Intermediate report on the second Afterlife survey
Goal study
Some general information about the respondents of the AAfterlife survey is presented. Second, the match between education and industries is investigated in terms of competences. Third, topics of interest (related to predefined work packages) are discussed. Themes include education pathways, drop-out pathways, mobility, employment, life satisfaction, work-life balance, job satisfaction, perceived success, and financial security.
Where indicated, differences between occupation fields (i.e. flow 1, flow 2, flow 3, flow 4), gender, and country are investigated and discussed.
Participants
Participation number
2637 participated in the survey, currently residing in 65 countries.
Gender
56% of the participants are female, 43 % are male.
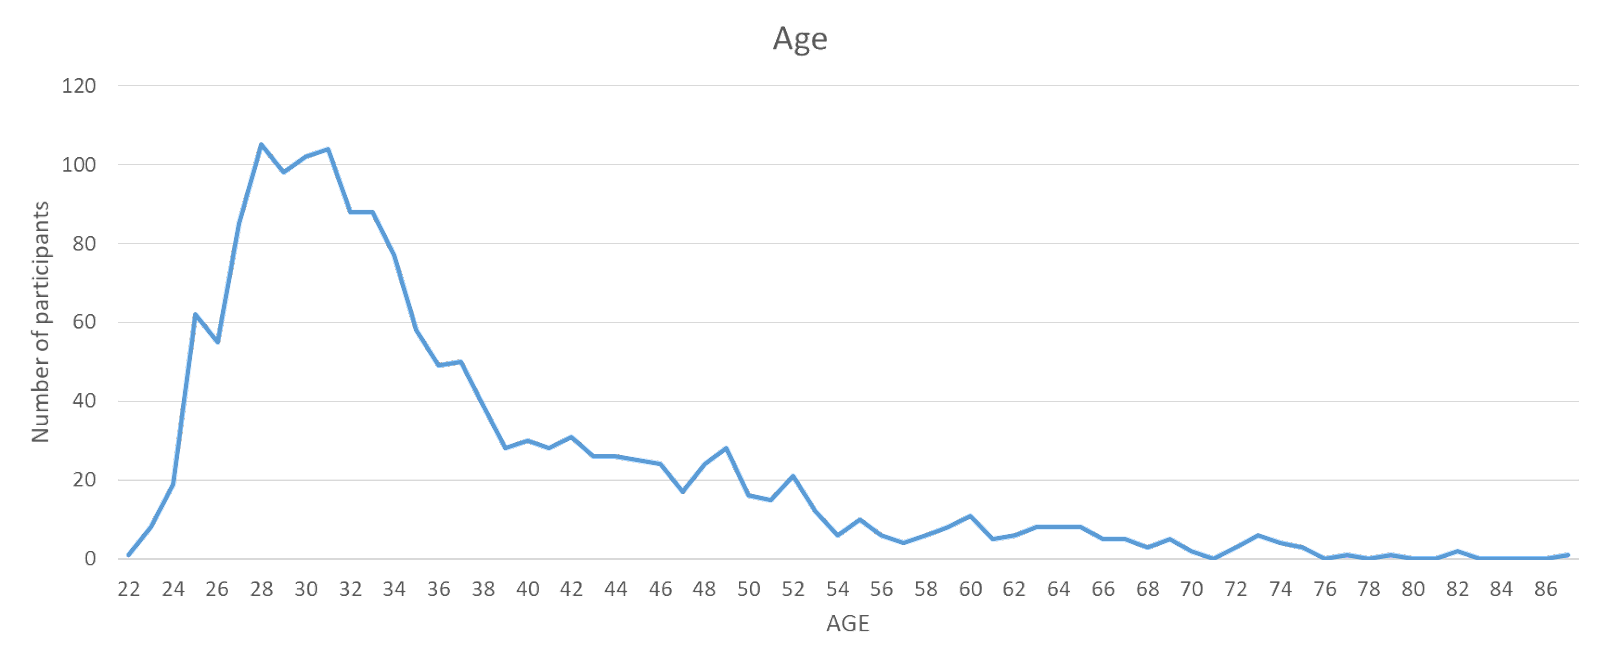
Age
Participants have an average age of 36,81 years (SD = 10,98). The distribution is graphically displayed below:
Country
65 different countries were represented in the survey. Countries of AAfterlife partners are included in the graph below.

Marital status
>75% is in a relationship (in a relationship or married).
Children
35.5% of the respondents have children. Note that a considerate number of participants is of young age (and might not have children yet).
Professional status
>80% have a paid profession.
Field of occupation
72% of those with a paid profession are currently working as an architect (62% in architecture only, 10% in combination with another field).

To know whether we are facing a sampling bias (e.g. more people reported working as an architect because we reached them through boards of architects), we compared the total of responses with responses only from people that were recruited through alumni offices (which will probably reach a more balanced variety of occupation profiles). No differences were found (for details: see below), so we can conclude that there is no sampling bias in relation to occupation fields. Hence, all responses will be included in further analysis.
The field of occupation is not different for man versus women.
However, the distribution is different for countries.
Match between education and industry
General results
Scale level
To see whether there is a (mis)match between education and industry, we compared the acquired competences during architectural education with the demands of the industry. Respondents indicated on a Likert scale (1 = Not at all, 5 = extremely well) how well they acquired a set of competences, and indicated how often they used this given set in their current job (1 = Never, 5 = Always).
|
How well did you acquire the following competences through your architectural education?
|
|
1 = Not at all
|
2 = Slightly
|
3 = Moderately
|
4 = Very well
|
5 = Extremely well
|
|
How often do you use the following competences in your current job?
|
|
1 Never
|
2 = Rarely
|
3 = Sometimes
|
4 = Often
|
5 = Always
|
We clustered the competences in the following groups: Skills and knowledge, Processing information, Personal competence, Presentation and communication, Diversity Competence, Cooperation competence, and Employability (for details, see below).
|
Skills and knowledge
|
Design-thinking (e.g. thinking out-of-the-box, solution-oriented, creativity,…)
Spatial skills (e.g. understanding space, sensitivity to spatial features,…)
Digital skills (e.g. proficient use of hard- and software, parametric approaches, …)
Visualization skills (e.g. hand drawing, model making, mixed media, artistic skills ...)
Theory and History (e.g. of architecture, art, culture, humanities,…)
Knowledge of sustainability (e.g. ecology, circular economy, energy performance, LCA,…)
Technical knowledge about buildings and construction (e.g. materials, physics, structures,...)
|
|
Processing information
|
Developing vision
Being passionate about architecture
Inquiring and questioning (e.g. investigating a brief for a project,...
Research skills (e.g. systematic investigation of a problem in order to gain a better insight)
Being critical (e.g. taking critical distance from own work)
Dealing with complexity
Decision making (e.g. taking a stance, making judgments,...)
Taking an artistic approach (e.g. addressing emotions, going beyond the conventional,...)
Producing something relevant
|
|
Personal competence
|
Determination (e.g. commitment, persistence, dedication, willingness to achieve,...)
Work ethic (e.g. self-discipline, willingness to work hard,...)
Endurance (e.g. working under pressure, handling stress and deadlines,...)
Handling criticism
Flexibility (e.g. adaptability, being open for change and renewal,...)
Constant learning and self-improvement
Dealing with uncertainty / being able to function in conditions of uncertainty
|
|
Presentation and communication
|
Presentation skills (e.g. selling an idea, public speaking,...)
|
|
Diversity Competence
|
Empathy (e.g. being interested in the story of someone else)
Openness to other views and ways of living
|
|
Cooperation competence
|
Working with clients
Collaboration skills (e.g. team work)
Mediating skills (e.g. negotiations, conflict mediation,...)
|
|
Employability
|
Project management skills (e.g. time management, productivity,…)
Business management skills (e.g. managing a business, company, department)
|
In the table below, the mean scores are displayed.
|
|
How well did you acquire the following competences through your architectural education? (M)
|
How often do you use the following competences in your current job? (M)
|
|
Skills and knowledge
|
3.40
|
3.70
|
|
Processing information
|
3.36
|
3.78
|
|
Personal competence
|
3.69
|
4.09
|
|
Presentation and communication
|
3.39
|
3.87
|
|
Diversity Competence
|
2.93
|
3.84
|
|
Cooperation competence
|
2.35
|
4.03
|
|
Employability
|
1.93
|
3.80
|
Generally, respondents reported that personal competences were the competences that they acquired the best during education. They also needed them the most in their current jobs. Also, skills and knowledge, and processing information were well acquired and often used. However, when we look at diversity competence, cooperation competence and employability, we see a possible mismatch. People reported that they use very often cooperation competences, but did not acquire them very well through education. Employability (project management skills and business management skills) was acquired the worst, while this was still quite often needed in the workplace.
Item level
How well did you acquire…
|
|
Mean
|
SD
|
|
Design-thinking (e.g. thinking out-of-the-box, solution-oriented, creativity,…)
|
3,73
|
0,915
|
|
Spatial skills (e.g. understanding space, sensitivity to spatial features,…)
|
4,01
|
0,788
|
|
Digital skills (e.g. proficient use of hard- and software, parametric approaches, …)
|
2,9
|
1,103
|
|
Visualization skills (e.g. hand drawing, model making, mixed media, artistic skills ...)
|
3,53
|
0,95
|
|
Theory and History (e.g. of architecture, art, culture, humanities,…)
|
3,76
|
0,799
|
|
Knowledge of sustainability (e.g. ecology, circular economy, energy performance, LCA,…)
|
2,49
|
0,968
|
|
Technical knowledge about buildings and construction (e.g. materials, physics, structures,...)
|
3,37
|
0,84
|
|
Developing vision
|
3,45
|
0,959
|
|
Being passionate about architecture
|
3,71
|
1,061
|
|
Inquiring and questioning (e.g. investigating a brief for a project,...)
|
3,22
|
1,057
|
|
Research skills (e.g. systematic investigation of a problem in order to gain a better insight)
|
3,2
|
1,031
|
|
Being critical (e.g. taking critical distance from own work)
|
3,59
|
1,05
|
|
Dealing with complexity
|
3,43
|
0,983
|
|
Decision making (e.g. taking a stance, making judgments,...)
|
3,17
|
1,058
|
|
Taking an artistic approach (e.g. addressing emotions, going beyond the conventional,...)
|
3,21
|
1,052
|
|
Producing something relevant
|
3,27
|
0,977
|
|
Determination (e.g. commitment, persistence, dedication, willingness to achieve,...)
|
3,77
|
1,018
|
|
Work ethic (e.g. self-discinpline, willingness to work hard,...)
|
3,78
|
1,076
|
|
Endurance (e.g. working under pressure, handling stress and deadlines,...)
|
4,16
|
0,933
|
|
Handling criticism
|
3,65
|
1,021
|
|
Flexibility (e.g. adaptability, being open for change and renewal,...)
|
3,56
|
1,015
|
|
Constant learning and self-improvement
|
3,63
|
0,984
|
|
Dealing with uncertainty / being able to function in conditions of uncertainty
|
3,23
|
1,129
|
|
Presentation skills (e.g. selling an idea, public speaking,...)
|
3,39
|
0,998
|
|
Empathy (e.g. being interested in the story of someone else)
|
2,69
|
1,166
|
|
Openness to other views and ways of living
|
3,17
|
1,097
|
|
Working with clients
|
1,72
|
0,89
|
|
Collaboration skills (e.g. team work)
|
3,32
|
1,065
|
|
Mediating skills (e.g. negotiations, conflict mediation,...)
|
2,03
|
1,021
|
|
Project management skills (e.g. time management, productivity,…)
|
2,32
|
1,138
|
|
Business management skills (e.g. managing a business, company, department)
|
1,54
|
0,781
|
How often do you use…
|
|
Mean
|
SD
|
|
Technical knowledge about buildings and construction (e.g. materials, physics, structures,...)
|
1,95
|
1,029
|
|
Being passionate about architecture
|
1,96
|
1,191
|
|
Theory and History (e.g. of architecture, art, culture, humanities,…)
|
2,09
|
1,199
|
|
Knowledge of sustainability (e.g. ecology, circular economy, energy performance, LCA,…)
|
2,15
|
1,177
|
|
Spatial skills (e.g. understanding space, sensitivity to spatial features,…)
|
2,78
|
1,315
|
|
Taking an artistic approach (e.g. addressing emotions, going beyond the conventional,...)
|
2,91
|
1,354
|
|
Visualization skills (e.g. hand drawing, model making, mixed media, artistic skills ...)
|
2,99
|
1,427
|
|
Business management skills (e.g. managing a business, company, department)
|
3,2
|
1,4
|
|
Developing vision
|
3,4
|
1,174
|
|
Mediating skills (e.g. negotiations, conflict mediation,...)
|
3,54
|
1,169
|
|
Inquiring and questioning (e.g. investigating a brief for a project,...)
|
3,59
|
1,217
|
|
Working with clients
|
3,6
|
1,186
|
|
Research skills (e.g. systematic investigation of a problem in order to gain a better insight)
|
3,66
|
1,068
|
|
Presentation skills (e.g. selling an idea, public speaking,...)
|
3,7
|
1,141
|
|
Producing something relevant
|
3,76
|
1,139
|
|
Openness to other views and ways of living
|
3,8
|
1,03
|
|
Empathy (e.g. being interested in the story of someone else)
|
3,82
|
1,041
|
|
Design-thinking (e.g. thinking out-of-the-box, solution-oriented, creativity,…)
|
3,84
|
1,094
|
|
Handling criticism
|
3,84
|
0,981
|
|
Digital skills (e.g. proficient use of hard- and software, parametric approaches, …)
|
3,85
|
1,145
|
|
Being critical (e.g. taking critical distance from own work)
|
3,88
|
0,961
|
|
Decision making (e.g. taking a stance, making judgments,...)
|
3,96
|
0,962
|
|
Project management skills (e.g. time management, productivity,…)
|
3,96
|
0,999
|
|
Endurance (e.g. working under pressure, handling stress and deadlines,...)
|
3,99
|
1,006
|
|
Dealing with complexity
|
4,05
|
0,888
|
|
Collaboration skills (e.g. team work)
|
4,09
|
0,944
|
|
Dealing with uncertainty / being able to function in conditions of uncertainty
|
4,15
|
0,823
|
|
Determination (e.g. commitment, persistence, dedication, willingness to achieve,...)
|
4,19
|
0,828
|
|
Flexibility (e.g. adaptability, being open for change and renewal,...)
|
4,23
|
0,779
|
|
Constant learning and self-improvement
|
4,26
|
0,771
|
|
Work ethic (e.g. self-discinpline, willingness to work hard,...)
|
4,38
|
0,663
|
Mismatches (the lower the number, the bigger the mismatch)
|
|
Mean
|
SD
|
|
Mismatch_working_with_clients
|
-2,409
|
1,32127
|
|
Mismatch_business_management_skills
|
-1,8771
|
1,47142
|
|
Mismatch_project_management_skills
|
-1,8571
|
1,39814
|
|
Mismatch_mediating_skills
|
-1,6756
|
1,34842
|
|
Mismatch_digital_skills
|
-1,4038
|
1,33433
|
|
Mismatch_emphaty
|
-1,1503
|
1,42101
|
|
Mismatch_decision_making
|
-1,0499
|
1,28148
|
|
Mismatch_collaboration_skills
|
-0,941
|
1,28433
|
|
Mismatch_knowledge_of_sustainability
|
-0,8407
|
1,38048
|
|
Mismatch_dealing_with_complexity
|
-0,8116
|
1,13684
|
|
Mismatch_dealing_with_uncertainty
|
-0,7536
|
1,34135
|
|
Mismatch_openess
|
-0,6686
|
1,3169
|
|
Mismatch_producing_something_relevant
|
-0,5922
|
1,25953
|
|
Mismatch_flexibility
|
-0,5808
|
1,16814
|
|
Mismatch_technical_knowledge
|
-0,5607
|
1,37431
|
|
Mismatch_constant_learning_selfimprovement
|
-0,5334
|
1,15007
|
|
Mismatch_work_ethic
|
-0,4995
|
1,14179
|
|
Mismatch_inquiring_and_questioning
|
-0,4953
|
1,32314
|
|
Mismatch_research_skills
|
-0,4873
|
1,34833
|
|
Mismatch_presentation_skills
|
-0,4862
|
1,392
|
|
Mismatch_being_critical
|
-0,4102
|
1,19522
|
|
Mismatch_determination
|
-0,3677
|
1,08149
|
|
Mismatch_developing_vision
|
-0,2533
|
1,2191
|
|
Mismatch_design_thinking
|
-0,2458
|
1,18583
|
|
Mismatch_handeling_criticism
|
-0,12
|
1,23535
|
|
Mismatch_spatial_skills
|
-0,1091
|
1,13966
|
|
Mismatch_vizualisation_skills
|
0,0019
|
1,4281
|
|
Mismatch_endurance
|
0,058
|
1,17411
|
|
Mismatch_taking_artistic_approach
|
0,1774
|
1,36552
|
|
Mismatch_being_passionate
|
0,1928
|
1,36543
|
|
Mismatch_theory_and_history
|
1,032
|
1,25525
|
|
Mean = Acquisition in education - Frequency used in work environment
|
|
Negative number = skill is not sufficiently acquired through education, given the requirements in the job market. The lower the number, the bigger the mismatch
|
|
Number around zero = balance between requirements in job market and competences learned through education
|
|
Positive number = skill is acquired more than needed through education, given the requirements in the job market
|
Note that ‘taking an artistic approach’, ‘being passionate about architecture’ and ‘theory and history’ are perceived as overstressed in the AE.
Differences between fields of occupation
Scale level
How well architecture graduates acquired these sets of competences, tends to depend from current occupation. However, this is only marginally significant. (p < 0.10 but >0.05). When we look at the between-subject effects (which we are technically not allowed to do when the multivariate test is not significant), we see that this might be due to a difference in ‘employability’. Employability in flow 4 > flow 3> flow 2 > flow 1.
How often architecture graduates need these sets of competences varies according to field of occupation. Significant differences were found for skills and knowledge, processing information, personal competences, and cooperation competences.
|
How often do you use… (M)
|
Skills and knowledge (M)
|
Processing information (M)
|
Personal competence (M)
|
Cooperation competence (M)
|
|
Architecture (Flow 1)
|
3,8634
|
3,8007
|
4,0481
|
4,0621
|
|
Architecture + other field (Flow 2)
|
3,7951
|
3,8316
|
4,1414
|
4,1785
|
|
Related sector (Flow 3)
|
3,5103
|
3,8368
|
4,2194
|
3,9880
|
|
Unrelated sector (Flow 4)
|
2,8077
|
3,4744
|
4,1392
|
3,7179
|
It is not surprising that skills and knowledge that are inherent to architecture are used more often by people who are working in architecture, or are combining architecture with another field. Processing information is used often in architecture, architecture + other field, but also in related sectors. It is less relevant for the unrelated sectors. Personal competences are important in all sectors, but especially in the related sectors. Cooperation competences are most frequently used by people who are combining architecture with another field.
Item level
How well did you acquire…
FLOW 1
|
|
Mean
|
SD
|
|
Business management skills (e.g. managing a business, company, department)
|
1,52
|
0,813
|
|
Working with clients
|
1,65
|
0,879
|
|
Mediating skills (e.g. negotiations, conflict mediation,...)
|
1,98
|
1,034
|
|
Project management skills (e.g. time management, productivity,…)
|
2,22
|
1,129
|
|
Knowledge of sustainability (e.g. ecology, circular economy, energy performance, LCA,…)
|
2,45
|
0,974
|
|
Empathy (e.g. being interested in the story of someone else)
|
2,66
|
1,17
|
|
Digital skills (e.g. proficient use of hard- and software, parametric approaches, …)
|
2,92
|
1,109
|
|
Openness to other views and ways of living
|
3,11
|
1,103
|
|
Decision making (e.g. taking a stance, making judgments,...)
|
3,16
|
1,069
|
|
Inquiring and questioning (e.g. investigating a brief for a project,...)
|
3,19
|
1,059
|
|
Dealing with uncertainty / being able to function in conditions of uncertainty
|
3,19
|
1,132
|
|
Research skills (e.g. systematic investigation of a problem in order to gain a better insight)
|
3,21
|
1,022
|
|
Taking an artistic approach (e.g. addressing emotions, going beyond the conventional,...)
|
3,23
|
1,04
|
|
Producing something relevant
|
3,26
|
0,978
|
|
Collaboration skills (e.g. team work)
|
3,28
|
1,079
|
|
Technical knowledge about buildings and construction (e.g. materials, physics, structures,...)
|
3,34
|
0,838
|
|
Dealing with complexity
|
3,35
|
0,963
|
|
Presentation skills (e.g. selling an idea, public speaking,...)
|
3,37
|
1,011
|
|
Developing vision
|
3,46
|
0,968
|
|
Visualization skills (e.g. hand drawing, model making, mixed media, artistic skills ...)
|
3,49
|
0,967
|
|
Flexibility (e.g. adaptability, being open for change and renewal,...)
|
3,5
|
0,994
|
|
Being critical (e.g. taking critical distance from own work)
|
3,57
|
1,032
|
|
Handling criticism
|
3,6
|
1,055
|
|
Constant learning and self-improvement
|
3,61
|
0,963
|
|
Design-thinking (e.g. thinking out-of-the-box, solution-oriented, creativity,…)
|
3,72
|
0,9
|
|
Being passionate about architecture
|
3,75
|
1,066
|
|
Determination (e.g. commitment, persistence, dedication, willingness to achieve,...)
|
3,75
|
1,018
|
|
Work ethic (e.g. self-discinpline, willingness to work hard,...)
|
3,75
|
1,096
|
|
Theory and History (e.g. of architecture, art, culture, humanities,…)
|
3,79
|
0,795
|
|
Spatial skills (e.g. understanding space, sensitivity to spatial features,…)
|
3,99
|
0,785
|
|
Endurance (e.g. working under pressure, handling stress and deadlines,...)
|
4,15
|
0,924
|
FLOW 2
|
|
Mean
|
SD
|
|
Business management skills (e.g. managing a business, company, department)
|
1,53
|
0,746
|
|
Working with clients
|
1,7
|
0,845
|
|
Mediating skills (e.g. negotiations, conflict mediation,...)
|
2,14
|
1,073
|
|
Project management skills (e.g. time management, productivity,…)
|
2,26
|
0,989
|
|
Knowledge of sustainability (e.g. ecology, circular economy, energy performance, LCA,…)
|
2,53
|
1,114
|
|
Digital skills (e.g. proficient use of hard- and software, parametric approaches, …)
|
2,7
|
1,148
|
|
Empathy (e.g. being interested in the story of someone else)
|
2,86
|
1,167
|
|
Decision making (e.g. taking a stance, making judgments,...)
|
3,1
|
1,105
|
|
Dealing with uncertainty / being able to function in conditions of uncertainty
|
3,19
|
1,088
|
|
Research skills (e.g. systematic investigation of a problem in order to gain a better insight)
|
3,23
|
1,149
|
|
Openness to other views and ways of living
|
3,27
|
0,993
|
|
Collaboration skills (e.g. team work)
|
3,29
|
1,023
|
|
Technical knowledge about buildings and construction (e.g. materials, physics, structures,...)
|
3,3
|
0,818
|
|
Inquiring and questioning (e.g. investigating a brief for a project,...)
|
3,3
|
1,087
|
|
Producing something relevant
|
3,32
|
1,036
|
|
Taking an artistic approach (e.g. addressing emotions, going beyond the conventional,...)
|
3,33
|
1,124
|
|
Presentation skills (e.g. selling an idea, public speaking,...)
|
3,37
|
0,929
|
|
Developing vision
|
3,41
|
0,997
|
|
Dealing with complexity
|
3,43
|
1,055
|
|
Visualization skills (e.g. hand drawing, model making, mixed media, artistic skills ...)
|
3,48
|
1,007
|
|
Being critical (e.g. taking critical distance from own work)
|
3,59
|
1,103
|
|
Flexibility (e.g. adaptability, being open for change and renewal,...)
|
3,68
|
1,019
|
|
Determination (e.g. commitment, persistence, dedication, willingness to achieve,...)
|
3,69
|
0,993
|
|
Handling criticism
|
3,71
|
0,966
|
|
Constant learning and self-improvement
|
3,73
|
0,973
|
|
Work ethic (e.g. self-discinpline, willingness to work hard,...)
|
3,74
|
0,989
|
|
Design-thinking (e.g. thinking out-of-the-box, solution-oriented, creativity,…)
|
3,79
|
0,983
|
|
Being passionate about architecture
|
3,8
|
0,979
|
|
Theory and History (e.g. of architecture, art, culture, humanities,…)
|
3,81
|
0,829
|
|
Spatial skills (e.g. understanding space, sensitivity to spatial features,…)
|
3,92
|
0,847
|
|
Endurance (e.g. working under pressure, handling stress and deadlines,...)
|
4,2
|
0,899
|
FLOW 3
|
|
Mean
|
SD
|
|
Business management skills (e.g. managing a business, company, department)
|
1,62
|
0,722
|
|
Working with clients
|
1,9
|
0,907
|
|
Mediating skills (e.g. negotiations, conflict mediation,...)
|
2,1
|
0,945
|
|
Project management skills (e.g. time management, productivity,…)
|
2,5
|
1,133
|
|
Knowledge of sustainability (e.g. ecology, circular economy, energy performance, LCA,…)
|
2,55
|
0,886
|
|
Empathy (e.g. being interested in the story of someone else)
|
2,75
|
1,134
|
|
Digital skills (e.g. proficient use of hard- and software, parametric approaches, …)
|
2,86
|
1,063
|
|
Research skills (e.g. systematic investigation of a problem in order to gain a better insight)
|
3,18
|
0,999
|
|
Taking an artistic approach (e.g. addressing emotions, going beyond the conventional,...)
|
3,2
|
1,039
|
|
Inquiring and questioning (e.g. investigating a brief for a project,...)
|
3,22
|
1,06
|
|
Openness to other views and ways of living
|
3,27
|
1,112
|
|
Decision making (e.g. taking a stance, making judgments,...)
|
3,28
|
1,016
|
|
Producing something relevant
|
3,3
|
0,949
|
|
Dealing with uncertainty / being able to function in conditions of uncertainty
|
3,38
|
1,118
|
|
Technical knowledge about buildings and construction (e.g. materials, physics, structures,...)
|
3,42
|
0,852
|
|
Collaboration skills (e.g. team work)
|
3,45
|
1,002
|
|
Presentation skills (e.g. selling an idea, public speaking,...)
|
3,48
|
0,956
|
|
Developing vision
|
3,51
|
0,898
|
|
Dealing with complexity
|
3,62
|
0,929
|
|
Flexibility (e.g. adaptability, being open for change and renewal,...)
|
3,66
|
1,023
|
|
Visualization skills (e.g. hand drawing, model making, mixed media, artistic skills ...)
|
3,67
|
0,875
|
|
Being critical (e.g. taking critical distance from own work)
|
3,68
|
1,043
|
|
Constant learning and self-improvement
|
3,69
|
0,983
|
|
Theory and History (e.g. of architecture, art, culture, humanities,…)
|
3,73
|
0,755
|
|
Handling criticism
|
3,76
|
0,879
|
|
Design-thinking (e.g. thinking out-of-the-box, solution-oriented, creativity,…)
|
3,77
|
0,919
|
|
Being passionate about architecture
|
3,77
|
0,965
|
|
Determination (e.g. commitment, persistence, dedication, willingness to achieve,...)
|
3,91
|
0,951
|
|
Work ethic (e.g. self-discinpline, willingness to work hard,...)
|
3,93
|
0,998
|
|
Spatial skills (e.g. understanding space, sensitivity to spatial features,…)
|
4,14
|
0,773
|
|
Endurance (e.g. working under pressure, handling stress and deadlines,...)
|
4,25
|
0,9
|
FLOW 4
|
|
Mean
|
SD
|
|
Business management skills (e.g. managing a business, company, department)
|
1,48
|
0,707
|
|
Working with clients
|
1,8
|
0,922
|
|
Mediating skills (e.g. negotiations, conflict mediation,...)
|
2,04
|
1,036
|
|
Empathy (e.g. being interested in the story of someone else)
|
2,46
|
1,188
|
|
Knowledge of sustainability (e.g. ecology, circular economy, energy performance, LCA,…)
|
2,52
|
0,942
|
|
Project management skills (e.g. time management, productivity,…)
|
2,8
|
1,242
|
|
Taking an artistic approach (e.g. addressing emotions, going beyond the conventional,...)
|
2,89
|
1,047
|
|
Research skills (e.g. systematic investigation of a problem in order to gain a better insight)
|
3,09
|
1,042
|
|
Decision making (e.g. taking a stance, making judgments,...)
|
3,09
|
1,019
|
|
Digital skills (e.g. proficient use of hard- and software, parametric approaches, …)
|
3,14
|
1,071
|
|
Being passionate about architecture
|
3,16
|
1,204
|
|
Dealing with uncertainty / being able to function in conditions of uncertainty
|
3,25
|
1,177
|
|
Presentation skills (e.g. selling an idea, public speaking,...)
|
3,27
|
1,078
|
|
Openness to other views and ways of living
|
3,27
|
1,123
|
|
Developing vision
|
3,28
|
0,983
|
|
Inquiring and questioning (e.g. investigating a brief for a project,...)
|
3,29
|
1,01
|
|
Producing something relevant
|
3,31
|
0,988
|
|
Collaboration skills (e.g. team work)
|
3,37
|
1,16
|
|
Constant learning and self-improvement
|
3,46
|
1,14
|
|
Technical knowledge about buildings and construction (e.g. materials, physics, structures,...)
|
3,51
|
0,84
|
|
Visualization skills (e.g. hand drawing, model making, mixed media, artistic skills ...)
|
3,53
|
0,907
|
|
Theory and History (e.g. of architecture, art, culture, humanities,…)
|
3,56
|
0,879
|
|
Being critical (e.g. taking critical distance from own work)
|
3,59
|
1,147
|
|
Flexibility (e.g. adaptability, being open for change and renewal,...)
|
3,62
|
1,129
|
|
Dealing with complexity
|
3,66
|
1,086
|
|
Work ethic (e.g. self-discinpline, willingness to work hard,...)
|
3,66
|
1,202
|
|
Design-thinking (e.g. thinking out-of-the-box, solution-oriented, creativity,…)
|
3,68
|
0,941
|
|
Determination (e.g. commitment, persistence, dedication, willingness to achieve,...)
|
3,69
|
1,189
|
|
Handling criticism
|
3,72
|
1,151
|
|
Spatial skills (e.g. understanding space, sensitivity to spatial features,…)
|
3,96
|
0,763
|
|
Endurance (e.g. working under pressure, handling stress and deadlines,...)
|
4,01
|
1,11
|
How often do you use…
FLOW 1
|
|
Mean
|
SD
|
|
Theory and History (e.g. of architecture, art, culture, humanities,…)
|
2,74
|
1,016
|
|
Taking an artistic approach (e.g. addressing emotions, going beyond the conventional,...)
|
3,06
|
1,056
|
|
Knowledge of sustainability (e.g. ecology, circular economy, energy performance, LCA,…)
|
3,42
|
0,971
|
|
Business management skills (e.g. managing a business, company, department)
|
3,42
|
1,281
|
|
Research skills (e.g. systematic investigation of a problem in order to gain a better insight)
|
3,61
|
1,019
|
|
Mediating skills (e.g. negotiations, conflict mediation,...)
|
3,63
|
1,074
|
|
Visualization skills (e.g. hand drawing, model making, mixed media, artistic skills ...)
|
3,66
|
1,083
|
|
Inquiring and questioning (e.g. investigating a brief for a project,...)
|
3,66
|
1,059
|
|
Developing vision
|
3,71
|
0,994
|
|
Handling criticism
|
3,71
|
0,91
|
|
Being passionate about architecture
|
3,76
|
1,067
|
|
Openness to other views and ways of living
|
3,81
|
0,972
|
|
Empathy (e.g. being interested in the story of someone else)
|
3,82
|
0,951
|
|
Presentation skills (e.g. selling an idea, public speaking,...)
|
3,85
|
0,984
|
|
Producing something relevant
|
3,9
|
1,004
|
|
Dealing with uncertainty / being able to function in conditions of uncertainty
|
3,9
|
0,904
|
|
Being critical (e.g. taking critical distance from own work)
|
3,97
|
0,866
|
|
Design-thinking (e.g. thinking out-of-the-box, solution-oriented, creativity,…)
|
4,05
|
0,912
|
|
Endurance (e.g. working under pressure, handling stress and deadlines,...)
|
4,06
|
0,864
|
|
Determination (e.g. commitment, persistence, dedication, willingness to achieve,...)
|
4,1
|
0,832
|
|
Flexibility (e.g. adaptability, being open for change and renewal,...)
|
4,1
|
0,796
|
|
Constant learning and self-improvement
|
4,1
|
0,884
|
|
Project management skills (e.g. time management, productivity,…)
|
4,18
|
0,872
|
|
Decision making (e.g. taking a stance, making judgments,...)
|
4,21
|
0,825
|
|
Dealing with complexity
|
4,22
|
0,806
|
|
Work ethic (e.g. self-discinpline, willingness to work hard,...)
|
4,26
|
0,788
|
|
Working with clients
|
4,26
|
0,942
|
|
Technical knowledge about buildings and construction (e.g. materials, physics, structures,...)
|
4,28
|
0,801
|
|
Collaboration skills (e.g. team work)
|
4,28
|
0,847
|
|
Spatial skills (e.g. understanding space, sensitivity to spatial features,…)
|
4,35
|
0,803
|
|
Digital skills (e.g. proficient use of hard- and software, parametric approaches, …)
|
4,49
|
0,815
|
FLOW 2
|
|
Mean
|
SD
|
|
Theory and History (e.g. of architecture, art, culture, humanities,…)
|
3,03
|
1,167
|
|
Taking an artistic approach (e.g. addressing emotions, going beyond the conventional,...)
|
3,17
|
1,18
|
|
Knowledge of sustainability (e.g. ecology, circular economy, energy performance, LCA,…)
|
3,48
|
0,988
|
|
Being passionate about architecture
|
3,56
|
1,143
|
|
Visualization skills (e.g. hand drawing, model making, mixed media, artistic skills ...)
|
3,64
|
1,025
|
|
Business management skills (e.g. managing a business, company, department)
|
3,69
|
1,163
|
|
Developing vision
|
3,75
|
1,003
|
|
Research skills (e.g. systematic investigation of a problem in order to gain a better insight)
|
3,79
|
1,026
|
|
Inquiring and questioning (e.g. investigating a brief for a project,...)
|
3,82
|
1,017
|
|
Openness to other views and ways of living
|
3,88
|
0,874
|
|
Producing something relevant
|
3,9
|
1,028
|
|
Handling criticism
|
3,92
|
0,813
|
|
Presentation skills (e.g. selling an idea, public speaking,...)
|
3,96
|
1,009
|
|
Mediating skills (e.g. negotiations, conflict mediation,...)
|
3,97
|
0,955
|
|
Empathy (e.g. being interested in the story of someone else)
|
3,99
|
0,872
|
|
Being critical (e.g. taking critical distance from own work)
|
4,02
|
0,909
|
|
Technical knowledge about buildings and construction (e.g. materials, physics, structures,...)
|
4,03
|
0,899
|
|
Dealing with uncertainty / being able to function in conditions of uncertainty
|
4,04
|
0,894
|
|
Design-thinking (e.g. thinking out-of-the-box, solution-oriented, creativity,…)
|
4,07
|
0,939
|
|
Determination (e.g. commitment, persistence, dedication, willingness to achieve,...)
|
4,07
|
0,873
|
|
Flexibility (e.g. adaptability, being open for change and renewal,...)
|
4,18
|
0,814
|
|
Constant learning and self-improvement
|
4,2
|
0,939
|
|
Project management skills (e.g. time management, productivity,…)
|
4,2
|
0,793
|
|
Spatial skills (e.g. understanding space, sensitivity to spatial features,…)
|
4,22
|
1,014
|
|
Digital skills (e.g. proficient use of hard- and software, parametric approaches, …)
|
4,24
|
0,931
|
|
Decision making (e.g. taking a stance, making judgments,...)
|
4,26
|
0,82
|
|
Working with clients
|
4,28
|
0,87
|
|
Work ethic (e.g. self-discinpline, willingness to work hard,...)
|
4,29
|
0,768
|
|
Collaboration skills (e.g. team work)
|
4,29
|
0,852
|
|
Dealing with complexity
|
4,31
|
0,809
|
|
Endurance (e.g. working under pressure, handling stress and deadlines,...)
|
4,37
|
0,747
|
FLOW 3
|
|
Mean
|
SD
|
|
Theory and History (e.g. of architecture, art, culture, humanities,…)
|
2,82
|
1,217
|
|
Taking an artistic approach (e.g. addressing emotions, going beyond the conventional,...)
|
2,93
|
1,188
|
|
Visualization skills (e.g. hand drawing, model making, mixed media, artistic skills ...)
|
3,2
|
1,199
|
|
Business management skills (e.g. managing a business, company, department)
|
3,36
|
1,367
|
|
Knowledge of sustainability (e.g. ecology, circular economy, energy performance, LCA,…)
|
3,39
|
1,124
|
|
Being passionate about architecture
|
3,4
|
1,222
|
|
Technical knowledge about buildings and construction (e.g. materials, physics, structures,...)
|
3,55
|
1,132
|
|
Developing vision
|
3,75
|
1,106
|
|
Design-thinking (e.g. thinking out-of-the-box, solution-oriented, creativity,…)
|
3,79
|
1,055
|
|
Producing something relevant
|
3,83
|
1,039
|
|
Empathy (e.g. being interested in the story of someone else)
|
3,84
|
0,9
|
|
Working with clients
|
3,84
|
1,118
|
|
Mediating skills (e.g. negotiations, conflict mediation,...)
|
3,85
|
0,998
|
|
Spatial skills (e.g. understanding space, sensitivity to spatial features,…)
|
3,88
|
0,999
|
|
Inquiring and questioning (e.g. investigating a brief for a project,...)
|
3,89
|
1,087
|
|
Research skills (e.g. systematic investigation of a problem in order to gain a better insight)
|
3,9
|
1,065
|
|
Handling criticism
|
3,9
|
0,848
|
|
Digital skills (e.g. proficient use of hard- and software, parametric approaches, …)
|
3,91
|
1,044
|
|
Presentation skills (e.g. selling an idea, public speaking,...)
|
3,94
|
0,982
|
|
Openness to other views and ways of living
|
3,96
|
0,903
|
|
Being critical (e.g. taking critical distance from own work)
|
4,13
|
0,829
|
|
Dealing with uncertainty / being able to function in conditions of uncertainty
|
4,15
|
0,814
|
|
Endurance (e.g. working under pressure, handling stress and deadlines,...)
|
4,19
|
0,852
|
|
Project management skills (e.g. time management, productivity,…)
|
4,24
|
0,946
|
|
Determination (e.g. commitment, persistence, dedication, willingness to achieve,...)
|
4,26
|
0,764
|
|
Flexibility (e.g. adaptability, being open for change and renewal,...)
|
4,26
|
0,72
|
|
Collaboration skills (e.g. team work)
|
4,27
|
0,862
|
|
Work ethic (e.g. self-discinpline, willingness to work hard,...)
|
4,29
|
0,752
|
|
Constant learning and self-improvement
|
4,3
|
0,782
|
|
Decision making (e.g. taking a stance, making judgments,...)
|
4,31
|
0,792
|
|
Dealing with complexity
|
4,37
|
0,788
|
FLOW 4
|
|
Mean
|
SD
|
|
Technical knowledge about buildings and construction (e.g. materials, physics, structures,...)
|
1,95
|
1,029
|
|
Being passionate about architecture
|
1,96
|
1,191
|
|
Theory and History (e.g. of architecture, art, culture, humanities,…)
|
2,09
|
1,199
|
|
Knowledge of sustainability (e.g. ecology, circular economy, energy performance, LCA,…)
|
2,15
|
1,177
|
|
Spatial skills (e.g. understanding space, sensitivity to spatial features,…)
|
2,78
|
1,315
|
|
Taking an artistic approach (e.g. addressing emotions, going beyond the conventional,...)
|
2,91
|
1,354
|
|
Visualization skills (e.g. hand drawing, model making, mixed media, artistic skills ...)
|
2,99
|
1,427
|
|
Business management skills (e.g. managing a business, company, department)
|
3,2
|
1,4
|
|
Developing vision
|
3,4
|
1,174
|
|
Mediating skills (e.g. negotiations, conflict mediation,...)
|
3,54
|
1,169
|
|
Inquiring and questioning (e.g. investigating a brief for a project,...)
|
3,59
|
1,217
|
|
Working with clients
|
3,6
|
1,186
|
|
Research skills (e.g. systematic investigation of a problem in order to gain a better insight)
|
3,66
|
1,068
|
|
Presentation skills (e.g. selling an idea, public speaking,...)
|
3,7
|
1,141
|
|
Producing something relevant
|
3,76
|
1,139
|
|
Openness to other views and ways of living
|
3,8
|
1,03
|
|
Empathy (e.g. being interested in the story of someone else)
|
3,82
|
1,041
|
|
Design-thinking (e.g. thinking out-of-the-box, solution-oriented, creativity,…)
|
3,84
|
1,094
|
|
Handling criticism
|
3,84
|
0,981
|
|
Digital skills (e.g. proficient use of hard- and software, parametric approaches, …)
|
3,85
|
1,145
|
|
Being critical (e.g. taking critical distance from own work)
|
3,88
|
0,961
|
|
Decision making (e.g. taking a stance, making judgments,...)
|
3,96
|
0,962
|
|
Project management skills (e.g. time management, productivity,…)
|
3,96
|
0,999
|
|
Endurance (e.g. working under pressure, handling stress and deadlines,...)
|
3,99
|
1,006
|
|
Dealing with complexity
|
4,05
|
0,888
|
|
Collaboration skills (e.g. team work)
|
4,09
|
0,944
|
|
Dealing with uncertainty / being able to function in conditions of uncertainty
|
4,15
|
0,823
|
|
Determination (e.g. commitment, persistence, dedication, willingness to achieve,...)
|
4,19
|
0,828
|
|
Flexibility (e.g. adaptability, being open for change and renewal,...)
|
4,23
|
0,779
|
|
Constant learning and self-improvement
|
4,26
|
0,771
|
|
Work ethic (e.g. self-discinpline, willingness to work hard,...)
|
4,38
|
0,663
|
Below, the mismatches are presented.
FLOW 1
|
|
Mean
|
SD
|
|
Mismatch_working_with_clients
|
-2,6092
|
1,23554
|
|
Mismatch_project_management_skills
|
-1,9631
|
1,38959
|
|
Mismatch_business_management_skills
|
-1,8938
|
1,4538
|
|
Mismatch_mediating_skills
|
-1,6466
|
1,36192
|
|
Mismatch_digital_skills
|
-1,5794
|
1,23526
|
|
Mismatch_emphaty
|
-1,1536
|
1,4189
|
|
Mismatch_decision_making
|
-1,062
|
1,27947
|
|
Mismatch_collaboration_skills
|
-1,0046
|
1,28362
|
|
Mismatch_knowledge_of_sustainability
|
-0,9681
|
1,2835
|
|
Mismatch_technical_knowledge
|
-0,9379
|
1,11851
|
|
Mismatch_dealing_with_complexity
|
-0,8811
|
1,14634
|
|
Mismatch_dealing_with_uncertainty
|
-0,7204
|
1,35937
|
|
Mismatch_openess
|
-0,6912
|
1,32139
|
|
Mismatch_producing_something_relevant
|
-0,6409
|
1,2598
|
|
Mismatch_flexibility
|
-0,5929
|
1,20072
|
|
Mismatch_work_ethic
|
-0,5139
|
1,18457
|
|
Mismatch_constant_learning_selfimprovement
|
-0,49
|
1,11263
|
|
Mismatch_presentation_skills
|
-0,4847
|
1,38837
|
|
Mismatch_inquiring_and_questioning
|
-0,4689
|
1,30589
|
|
Mismatch_being_critical
|
-0,4094
|
1,18865
|
|
Mismatch_research_skills
|
-0,3909
|
1,31014
|
|
Mismatch_spatial_skills
|
-0,3632
|
0,97158
|
|
Mismatch_determination
|
-0,358
|
1,07014
|
|
Mismatch_design_thinking
|
-0,3298
|
1,13224
|
|
Mismatch_developing_vision
|
-0,2598
|
1,19967
|
|
Mismatch_vizualisation_skills
|
-0,1939
|
1,38558
|
|
Mismatch_handeling_criticism
|
-0,1003
|
1,27785
|
|
Mismatch_being_passionate
|
-0,0106
|
1,28977
|
|
Mismatch_endurance
|
0,0938
|
1,16529
|
|
Mismatch_taking_artistic_approach
|
0,1672
|
1,29958
|
|
Mismatch_theory_and_history
|
1,0561
|
1,15224
|
FLOW 2
|
|
Mean
|
SD
|
|
Mismatch_working_with_clients
|
-2,5905
|
1,25342
|
|
Mismatch_business_management_skills
|
-2,1619
|
1,44198
|
|
Mismatch_project_management_skills
|
-1,9423
|
1,23718
|
|
Mismatch_mediating_skills
|
-1,8381
|
1,32378
|
|
Mismatch_digital_skills
|
-1,5377
|
1,32503
|
|
Mismatch_decision_making
|
-1,1714
|
1,37601
|
|
Mismatch_emphaty
|
-1,1238
|
1,4656
|
|
Mismatch_collaboration_skills
|
-0,9905
|
1,1477
|
|
Mismatch_knowledge_of_sustainability
|
-0,9528
|
1,29012
|
|
Mismatch_dealing_with_complexity
|
-0,8857
|
1,18739
|
|
Mismatch_dealing_with_uncertainty
|
-0,8491
|
1,32228
|
|
Mismatch_technical_knowledge
|
-0,7264
|
1,2462
|
|
Mismatch_openess
|
-0,6019
|
1,30113
|
|
Mismatch_presentation_skills
|
-0,5905
|
1,38464
|
|
Mismatch_producing_something_relevant
|
-0,5769
|
1,35598
|
|
Mismatch_research_skills
|
-0,5714
|
1,49908
|
|
Mismatch_work_ethic
|
-0,5566
|
1,06976
|
|
Mismatch_inquiring_and_questioning
|
-0,5096
|
1,46145
|
|
Mismatch_flexibility
|
-0,5
|
1,14018
|
|
Mismatch_constant_learning_selfimprovement
|
-0,4615
|
1,27655
|
|
Mismatch_being_critical
|
-0,4327
|
1,34211
|
|
Mismatch_determination
|
-0,3942
|
1,161
|
|
Mismatch_developing_vision
|
-0,3429
|
1,26208
|
|
Mismatch_spatial_skills
|
-0,2925
|
0,98529
|
|
Mismatch_design_thinking
|
-0,2736
|
1,19947
|
|
Mismatch_handeling_criticism
|
-0,217
|
1,06014
|
|
Mismatch_endurance
|
-0,1698
|
1,07324
|
|
Mismatch_vizualisation_skills
|
-0,1604
|
1,28831
|
|
Mismatch_taking_artistic_approach
|
0,1619
|
1,51989
|
|
Mismatch_being_passionate
|
0,2404
|
1,38294
|
|
Mismatch_theory_and_history
|
0,783
|
1,52443
|
FLOW 3
|
|
Mean
|
SD
|
|
Mismatch_working_with_clients
|
-1,9393
|
1,42118
|
|
Mismatch_project_management_skills
|
-1,7581
|
1,39328
|
|
Mismatch_mediating_skills
|
-1,7535
|
1,32893
|
|
Mismatch_business_management_skills
|
-1,7395
|
1,54891
|
|
Mismatch_emphaty
|
-1,0837
|
1,36117
|
|
Mismatch_digital_skills
|
-1,0741
|
1,40897
|
|
Mismatch_decision_making
|
-1,0234
|
1,2426
|
|
Mismatch_knowledge_of_sustainability
|
-0,8605
|
1,45302
|
|
Mismatch_collaboration_skills
|
-0,8131
|
1,28648
|
|
Mismatch_dealing_with_uncertainty
|
-0,7559
|
1,3376
|
|
Mismatch_dealing_with_complexity
|
-0,7277
|
1,03296
|
|
Mismatch_research_skills
|
-0,7056
|
1,41164
|
|
Mismatch_openess
|
-0,6822
|
1,38807
|
|
Mismatch_inquiring_and_questioning
|
-0,6573
|
1,28486
|
|
Mismatch_constant_learning_selfimprovement
|
-0,6121
|
1,16846
|
|
Mismatch_flexibility
|
-0,586
|
1,13598
|
|
Mismatch_producing_something_relevant
|
-0,5118
|
1,22808
|
|
Mismatch_presentation_skills
|
-0,4626
|
1,40956
|
|
Mismatch_being_critical
|
-0,4465
|
1,198
|
|
Mismatch_work_ethic
|
-0,3598
|
1,04656
|
|
Mismatch_determination
|
-0,3488
|
1,05644
|
|
Mismatch_developing_vision
|
-0,2488
|
1,25483
|
|
Mismatch_handeling_criticism
|
-0,1395
|
1,14348
|
|
Mismatch_technical_knowledge
|
-0,1302
|
1,38137
|
|
Mismatch_design_thinking
|
-0,0138
|
1,25639
|
|
Mismatch_endurance
|
0,0607
|
1,13462
|
|
Mismatch_spatial_skills
|
0,2581
|
1,15379
|
|
Mismatch_taking_artistic_approach
|
0,2837
|
1,41371
|
|
Mismatch_being_passionate
|
0,3972
|
1,30229
|
|
Mismatch_vizualisation_skills
|
0,4608
|
1,41408
|
|
Mismatch_theory_and_history
|
0,912
|
1,37643
|
FLOW 4
|
|
Mean
|
SD
|
|
Mismatch_working_with_clients
|
-1,8
|
1,3255
|
|
Mismatch_business_management_skills
|
-1,7375
|
1,40292
|
|
Mismatch_mediating_skills
|
-1,4875
|
1,31201
|
|
Mismatch_emphaty
|
-1,3375
|
1,54218
|
|
Mismatch_project_management_skills
|
-1,15
|
1,4764
|
|
Mismatch_dealing_with_uncertainty
|
-0,8889
|
1,23491
|
|
Mismatch_decision_making
|
-0,8659
|
1,27427
|
|
Mismatch_constant_learning_selfimprovement
|
-0,7654
|
1,20698
|
|
Mismatch_collaboration_skills
|
-0,7
|
1,41779
|
|
Mismatch_digital_skills
|
-0,6829
|
1,52249
|
|
Mismatch_work_ethic
|
-0,679
|
1,10484
|
|
Mismatch_research_skills
|
-0,5854
|
1,21667
|
|
Mismatch_flexibility
|
-0,575
|
1,02839
|
|
Mismatch_openess
|
-0,5316
|
1,09586
|
|
Mismatch_determination
|
-0,4625
|
1,14675
|
|
Mismatch_producing_something_relevant
|
-0,4268
|
1,20729
|
|
Mismatch_presentation_skills
|
-0,425
|
1,40321
|
|
Mismatch_dealing_with_complexity
|
-0,378
|
1,16153
|
|
Mismatch_being_critical
|
-0,2927
|
1,04808
|
|
Mismatch_inquiring_and_questioning
|
-0,2683
|
1,35217
|
|
Mismatch_design_thinking
|
-0,1463
|
1,32518
|
|
Mismatch_handeling_criticism
|
-0,0988
|
1,34727
|
|
Mismatch_developing_vision
|
-0,0976
|
1,23338
|
|
Mismatch_taking_artistic_approach
|
0
|
1,5396
|
|
Mismatch_endurance
|
0,0617
|
1,4348
|
|
Mismatch_knowledge_of_sustainability
|
0,378
|
1,47941
|
|
Mismatch_vizualisation_skills
|
0,5732
|
1,56371
|
|
Mismatch_spatial_skills
|
1,1951
|
1,38278
|
|
Mismatch_being_passionate
|
1,2317
|
1,54998
|
|
Mismatch_theory_and_history
|
1,4756
|
1,22953
|
|
Mismatch_technical_knowledge
|
1,561
|
1,13418
|
Differences between gender
How often architecture graduates need these sets of competences varies according to gender. Interestingly, women reported some competences to be more frequently needed. Whether this is an actual difference, or this is a perceived difference is not clear from the data, but can be an interesting topic to explore in further research. Significant differences were found for personal competences, diversity competences, and cooperation competences.
Differences between financial security
How often architecture graduates need these sets of competences varies according to their income. The higher the income, the more they reported that given competences were needed. In the analyses, people who did not want to reveal their income, were selected out. The effect of income persisted when gender was added to the model. (However, women tend to earn less, see Financial security, while they still reported to need the frequencies more often, see Differences between gender.). Significant differences were found for all competences, except for skills and knowledge.
Interestingly, this effect was not found when we inspected ‘perceived financial security’ (see topic: Financial security).
Professional activities
Participants were asked about how often they dealt with several activities in their professional lives.. Professional activities were measured on a Likert scale from 1 (= never) to 5 (= always) with the item “How often do you have to deal with the following aspects in your professional life or professional activities?” Descriptives (mean scores and standard deviations) for each activity are given below.
|
|
Mean
|
SD
|
|
Leading others
|
3,43
|
1,135
|
|
Following orders and instructions
|
3,53
|
,977
|
|
Practical, executing work
|
3,86
|
1,057
|
|
Helping others
|
3,63
|
,866
|
|
Financial matters
|
2,93
|
1,262
|
|
Managing the business, company, or department
|
2,75
|
1,475
|
|
Artistic work (art)
|
2,74
|
1,136
|
|
Developing new techniques or new ideas
|
3,23
|
1,051
|
|
Selling products or services to consumers
|
1,97
|
1,199
|
|
Giving training, education or guidance to others
|
2,69
|
1,236
|
|
Creative work (being creative, searching for creative solutions,…)
|
3,61
|
1,004
|
|
Communication with people within the business, company, or department
|
4,06
|
,982
|
|
Communication with people outside the business, company, or department
|
3,80
|
,996
|
|
Physical work, manual labor
|
1,73
|
,901
|
|
Taking care of, treating, or healing people
|
1,42
|
,841
|
|
Taking care of, treating, or healing animals
|
1,18
|
,601
|
|
Outdoor work (working in gardens, forests or on the field)
|
1,50
|
,824
|
|
Working with or on machines
|
1,59
|
1,047
|
|
Conducting and/or carrying out research
|
2,33
|
1,235
|
Communicating with other people is the most frequent activity. Practical, executing work is also often carried out. Also, a lot of people consider their jobs as ‘helping others’. How often people carry out these activities differs according to their field. The activities for which statistical differences were found, are flagged with an asterisk.
|
|
Architecture
(flow 1) (M)
|
Architecture + other field
(flow 2) (M)
|
Related sector
(flow 3) (M)
|
Unrelated sector
(flow 4) (M)
|
|
Leading others*
|
3,33
|
3,66
|
3,53
|
3,58
|
|
Following orders and instructions
|
3,55
|
3,39
|
3,53
|
3,60
|
|
Practical, executing work*
|
4,00
|
3,91
|
3,43
|
3,81
|
|
Helping others*
|
3,56
|
3,64
|
3,77
|
3,81
|
|
Financial matters*
|
2,85
|
3,16
|
3,05
|
2,81
|
|
Managing the business, company, or department*
|
2,65
|
3,1
|
2,83
|
2,83
|
|
Artistic work (art) *
|
2,79
|
2,94
|
2,45
|
2,82
|
|
Developing new techniques or new ideas*
|
3,13
|
3,29
|
3,34
|
3,62
|
|
Selling products or services to consumers*
|
1,95
|
2,04
|
1,92
|
2,16
|
|
Giving training, education or guidance to others*
|
2,47
|
3,09
|
2,99
|
3,11
|
|
Creative work (being creative, searching for creative solutions,…) *
|
3,67
|
3,73
|
3,37
|
3,57
|
|
Communication with people within the business, company, or department
|
4,03
|
3,92
|
4,15
|
4,17
|
|
Communication with people outside the business, company, or department
|
3,81
|
3,77
|
3,80
|
3,69
|
|
Physical work, manual labor*
|
1,73
|
2,10
|
1,53
|
1,81
|
|
Taking care of, treating, or healing people
|
1,41
|
1,57
|
1,35
|
1,43
|
|
Taking care of, treating, or healing animals*
|
1,20
|
1,29
|
1,08
|
1,09
|
|
Outdoor work (working in gardens, forests or on the field) *
|
1,50
|
1,72
|
1,45
|
1,27
|
|
Working with or on machines*
|
1,61
|
1,81
|
1,43
|
1,64
|
|
Conducting and/or carrying out research*
|
2,12
|
2,69
|
2,81
|
2,30
|
Topics of interest
Education pathways
Degree
The vast majority of respondents obtained a master degree or equivalent (>80%). Note that this is probably an artifact of the response collection.
The obtained degree varied across field of occupation. The higher the degree, the more likely respondents were to actually work as an architect.
Also, this distribution varies across countries (depending on regulation).
|
|
Belgium
|
Croatia
|
Italy
|
Spain
|
United kingdom
|
|
No degree (I started architecture education but did not complete any cycle)
|
0
|
0
|
1
|
2
|
0
|
|
Bachelor degree or equivalent (e.g. under-graduate diploma, RIBA part 1, first cycle,...)
|
4
|
0
|
3
|
29
|
44
|
|
Master degree or equivalent (e.g. graduate diploma, RIBA part 2, second cycle,...)
|
157
|
188
|
54
|
203
|
19
|
|
Doctoral degree
|
7
|
5
|
15
|
27
|
8
|
Internship/ work experience during studies
The vast majority of respondents got some work experience in any form during their architecture studies.
|
During your studies, did you gain some work experience in architecture?
|
|
|
Frequency
|
Percent
|
|
Yes, this was part of an internship within the curriculum.
|
655
|
33
|
|
Yes, as an unpaid volunteer outside the curriculum.
|
183
|
9
|
|
Yes, as a paid worker outside the curriculum.
|
827
|
41
|
|
No
|
256
|
13
|
|
Other
|
86
|
4
|
The average duration of work experience during studies was over one year (M = 15 months, SD = 16).
Extra studies
22% of the respondents completed other studies after studying architecture. Approximately half of them studied something different in the architectural field.
The people that completed another architecture study (besides their initial study of architecture), did that in the following domains:
|
|
Frequency
|
Percent
|
|
Interior architecture
|
14
|
6
|
|
Urban planning
|
49
|
20
|
|
Regional planning
|
16
|
6
|
|
Landscape architecture
|
13
|
5
|
|
Theory/History/Critics
|
18
|
7
|
|
Historic preservation
|
22
|
9
|
|
Heritage studies
|
21
|
8
|
|
Building information modelling
|
12
|
5
|
|
Real estate
|
3
|
1
|
|
Other
|
82
|
33
|
Most alumni (60%) followed the extra study after their initial architecture studies. The distribution is as follows:
|
|
When did you follow these studies?
|
|
|
Frequency
|
Percent
|
|
Before my (initial) architecture study
|
77
|
21
|
|
During my (initial) architecture study
|
70
|
19
|
|
After my (initial) architecture study
|
227
|
60
|
The most important reason to do more than one study was out of personal interest (33%). The acquisition of specific knowledge/skills comes second (27%), and the increase of chances on the job market third (20%). Only 9% reported that they initiated another study due to a lack of acquired knowledge/skills in their previous study.
Whether respondents completed another (architecture) study differed from country. In some countries, it is far more common to start extra studies than in other countries.
|
|
Belgium
|
Croatia
|
Italy
|
Spain
|
United kingdom
|
|
Yes
|
66
|
14
|
18
|
58
|
48
|
|
No
|
94
|
175
|
52
|
186
|
105
|
It is not surprising that people who are (also) working in related sectors/outside architecture are more likely to have finished another study. Only 13% of people working exclusively as an architect have completed other studies (flow 1), versus 24% of people in architecture + other sector (flow 2), 37% of people working in a related sector (flow 3) and 34% of people working in an unrelated sector (flow 4).
Satisfaction with choice
Participants were asked whether they would opt again for architecture studies if they could choose again. 75% would choose architecture again.
71% would also choose the same institution. Differences between institutions were found.
As expected, people who are working outside architecture are less likely to choose architecture again. 81% of people working exclusively as an architect would again opt for architecture (flow 1), 70% of people in architecture + other sector (flow 2), 79% of people working in a related sector (flow 3) versus only 39% of people working in an unrelated sector (flow 4). Note that the majority of people working in a related sector would still choose architecture!
Drop-out pathways
In education
Participants who did not complete their architecture studies did not complete any cycle (0,5%), or stopped after obtaining their bachelor degree (9%) (see also: Degree). Obviously, in reality, the drop-out rate is much higher, but because this survey was directed at architecture alumni, we have only a small number of people who dropped out of their architecture studies.
It becomes more interesting when we look at the reasons why people dropped out. Students who stopped before obtaining any degree did so mainly because of the poor quality of the study (21%) or due to financial reasons (21%). Students who stopped after the bachelor did so mainly because of other reasons (31%) (e.g. being fully qualified/no extra diploma requirements, career change, chance to study abroad,…) or because they lacked interest or motivation to continue their studies (19%).
|
|
What is the reason that you did not continue your architectural studies?
|
|
|
No degree
|
Stopped after bachelor
|
No degree
|
Stopped after bachelor
|
|
|
Frequency
|
Percent
|
|
Lack of time
|
0
|
17
|
0
|
9
|
|
Schedule conflicts (e.g. work/study)
|
1
|
16
|
5
|
8
|
|
Lack of interest/motivation
|
3
|
37
|
16
|
19
|
|
The workload of the study
|
2
|
17
|
11
|
9
|
|
The quality of the study
|
4
|
12
|
21
|
6
|
|
Health reasons
|
1
|
5
|
5
|
3
|
|
Family reasons
|
2
|
6
|
11
|
3
|
|
Financial reasons
|
4
|
23
|
21
|
12
|
|
Other
|
2
|
60
|
11
|
31
|
In professional life
People who stopped working as an architect (so people who are not part of flow 1 and flow 2 anymore), did so after average 6,24 years of working as an architect. However, there is a large standard deviation (SD = 6,00), so a lot of variety in drop-out timing exists.
|
Descriptive Statistics
|
|
|
N
|
Minimum
|
Maximum
|
Mean
|
Std. Deviation
|
|
Stop_after_x_years
|
230
|
,00
|
35,00
|
6,2391
|
5,99558
|
|
Valid N (listwise)
|
230
|
|
|
|
|
35% of people who indicated that they are currently not working as an architect (i.e. people in flow 3 and flow 4) reveal that they never worked as an architect.
|
Have you ever worked as an architect?
|
|
|
Frequency
|
Percent
|
Valid Percent
|
Cumulative Percent
|
|
Valid
|
Yes
|
251
|
10,4
|
64,7
|
64,7
|
|
No
|
137
|
5,7
|
35,3
|
100,0
|
|
Total
|
388
|
16,1
|
100,0
|
|
|
Missing
|
System
|
2024
|
83,9
|
|
|
|
Total
|
2412
|
100,0
|
|
|
When asked about the reasons why they are currently not working as an architect, participants stated the following: the main reason to leave the sector/not start working in the sector is because of interest in another job/sector.
|
|
Why are you (currently) not working as an architect?
|
|
|
Frequency
|
Percent
|
|
Not my own choice (e.g. resignation, not enough jobs)
|
2
|
4
|
|
Financial reasons
|
9
|
17
|
|
Lack of interest/motivation to work in architecture
|
7
|
13
|
|
More interest in another job/sector
|
13
|
24
|
|
Practical reasons
|
6
|
11
|
|
Work conditions
|
6
|
11
|
|
Family reasons
|
2
|
4
|
|
Health reasons
|
1
|
2
|
|
I work in architectural education/research
|
5
|
9
|
|
Other
|
3
|
6
|
Note that these are small numbers. This is due to a problem with the question, which was only at later stage shown to the people who indicated that they were not currently working as an architect. Nevertheless, we can already spot some trends.
Was leaving the sector of architecture the right choice? Most people are convinced it was. 62% says it was the right choice, 29% doubts, only 8% has regrets.
Again, this question has small numbers of respondents due to the same problem.
People who are combining architecture with another job (flow 2) (so technically, they are not ‘dropped out’), started combining their jobs after an average of 3,79 years. The standard deviation is again quite high (SD = 4,87), which indicates a considerable amount of variety.
People who are combining architecture with another job (flow 2), revealed why they decided to take up an additional job. They give the following reasons:
Again, the most important reason to combine the architectural job with another job is interest. Financial reasons and the wish to broaden skills come on a shared second place.
|
|
Why are you (currently) not working as an architect?
|
|
|
Frequency
|
Percent
|
|
Financial reasons
|
45
|
18
|
|
Larger interests
|
81
|
32
|
|
Broaden skills
|
45
|
18
|
|
Practical reasons
|
16
|
6
|
|
Better work conditions
|
25
|
10
|
|
Stay in touch with practice (e.g. in case of an educational job)
|
28
|
11
|
|
Other
|
11
|
4
|
Mobility
During studies
4,5% of architecture graduates receive their diploma in another country than the country where they started studying.
|
|
Frequency
|
Percent
|
|
Received diploma in same country as country where studies were started.
|
1469
|
95,5
|
|
Received diploma in a different country than country where studies were started.
|
70
|
4,5
|
No differences for occupational sectors were detected, and no gender differences were detected.
There were differences across countries (0 = no move, 1 = move):
When only including birth year >1970, 4,6% received the diploma in a different county than the country were studies were started. This is analogous to the previous results, as the majority of the respondents was quite young.
After studies
16% of architecture graduates with a master thesis lives in another country than the country where the diploma was received.
|
|
Frequency
|
Percent
|
|
Living in same country as country where master thesis was obtained
|
1299
|
84
|
|
Living in different country than country where master thesis was obtained
|
240
|
16
|
No differences for occupational sectors were detected, and no gender differences were detected.
There were differences across countries (0 = no move, 1 = move):
When only including birth year >1970, 16,1% lived in a different country than the country where the master thesis was obtained. This is analogous to the previous results, as the majority of the respondents was quite young.
Employment
As mentioned in Professional status, 82% of the respondents had a paid profession, while 4% is unemployed. The reasons for unemployment are the following:
The most important reasons for unemployment are ‘not enough suitable job vacancies’ (26%) and ‘the current economic situation’(23%). Also other reasons are mentioned. Several times, people mention ‘not enough experience’ or ‘unsure what I want to do’ as unemployment reason. Also, more alarming reasons are described under ‘other’, such as: “where I was working until a week ago, they have decided to do without my services since hiring an intern is cheaper than a licensed person,” “job offers have inhumane conditions”, “great desire to work, but not with a minimum wage percentage,” “poor salary after sacrifices in a shoddy faculty with stringent graduation deadlines,” and “repeated bullying by male employers and being treated abysmally by them since I became a mother has led to depression, stress and anxiety in relation to working as an architect, causing me in the end to resign a position and not being in a fit mental state to recommence a job search”.
There is no gender difference when it comes to reasons of unemployment.
The majority of the working respondents works fulltime.
|
Full time
|
89,6%
|
|
Part time (>70%)
|
5,2%
|
|
Part time (51%- 70%)
|
2,5%
|
|
Part time (50%)
|
1,9%
|
|
Part time (< 50%)
|
,8%
|
The distribution of fulltime versus parttime working respondents does not differ across fields of occupation. However, there is a trend of women working more frequently parttime (13%) than man (8%).
The people who are working in architecture (flow 1 and flow 2) have the following work situation:
Most architects work as private practice salaried employees (39%). Freelance work, and sole principal, partner/director architects are also common work situations.
|
|
What situation describes your work situation as an architect?
|
|
|
Frequency
|
Percent
|
|
Sole principal
|
165
|
15
|
|
Partner/director
|
165
|
15
|
|
Freelance
|
225
|
20
|
|
Private practice salaried employee
|
433
|
39
|
|
Other private
|
28
|
3
|
|
Local/central governement
|
50
|
5
|
|
Other public
|
40
|
4
|
People who are working in a related sector (from flow 2 and flow 3) work in the following sectors:
Education and research form a rather large employment sector (24%).
|
|
Frequency
|
Percent
|
|
Interior architecture
|
73
|
9
|
|
Urban planning
|
76
|
9
|
|
Landscape design
|
24
|
3
|
|
Building construction
|
78
|
9
|
|
Engineering
|
34
|
4
|
|
Consultancy
|
74
|
9
|
|
Building materials
|
10
|
1
|
|
Real estate
|
39
|
5
|
|
Creative industries
|
55
|
7
|
|
ICT
|
14
|
2
|
|
Governance/local or national authorities
|
60
|
7
|
|
Primary or secondary education
|
18
|
2
|
|
Higher education
|
99
|
12
|
|
Research
|
84
|
10
|
|
Other
|
90
|
11
|
Life satisfaction
Life satisfaction was measured on a Likert scale from 1 (= Strongly disagree) to 5 (= Strongly agree), with items such as “in most areas my life is almost ideal”, “So far, I obtained the things that I wanted most in life”. The average life satisfaction was 3,4 (SD = 0.76), which is slightly leaning towards to the ‘satisfied’ side of the spectrum.
However, there is a difference across the occupational sectors. People who are working in a related sector (flow 3) seem to be the happiest with their lives. People who are combining architecture with other sectors (flow 2) report the lowest life satisfaction.
No differences in life satisfaction were found for gender.
Life satisfaction is the highest for married or widowed people, and the lowest for singles. People who are in a relationship or people who are divorced score in between. The more children people have, the more life satisfaction they report. These trends might be partially explained by age. The older people get, the more life satisfaction they might report. However, when we add birth year in the model, birth year becomes insignificant, and the impact of marital status and children remains.
|
|
Mean life satisfaction
|
SD
|
N
|
|
Single
|
3,1394
|
,80880
|
297
|
|
In a relationship
|
3,3764
|
,75606
|
516
|
|
Married
|
3,6286
|
,68374
|
511
|
|
Divorced
|
3,4000
|
,69857
|
31
|
|
Widowed
|
3,8182
|
,69544
|
11
|
|
Total
|
3,4233
|
,76281
|
1366
|
|
|
Mean life satisfaction
|
SD
|
N
|
|
No children
|
3,3064
|
,77379
|
874
|
|
1 child
|
3,5679
|
,72879
|
162
|
|
2 children
|
3,6373
|
,69361
|
241
|
|
3 or more children
|
3,7099
|
,65338
|
91
|
|
Total
|
3,4225
|
,76306
|
1368
|
Work-life conflict
Work-life conflict was measured on a Likert scale from 1 (= Strongly disagree) to 5 (= Strongly agree), with items such as “It has been difficult for me to fulfill my family responsibilities because of the amount of time I spend on my job”, “I find it difficult to “switch” off when I finish work,” “My work effects my enjoyment of my social life,” ”I have arrived at work too tired to function well because of the household work I had done”. The higher the score, the less balance is experienced. Note that this scale not only measures the impact of work of private life, but also the other way. The average life work-life balance was 2,9 (SD = 0.76), which is approximately in the middle of the work-life balance spectrum.
However, there is a difference across the occupational sectors. Only flow 1 and flow 2 were compared. In the future, everyone with a paid profession will be questioned about work-life balance. People who are combining architecture with another sector (flow 2) seem to experience more work-life conflict (M = 3,21) than people who are solely working in architecture (M = 2,92) (flow 1).
No gender effects were found for work-life conflict, which means that men and women report equally low or high work-life conflict. Also, marital status and the presence of children did not affect work-life conflict.
Job satisfaction
Job satisfaction was measured on a Likert scale from 1 (= Very dissatisfied) to 5 (= Very satisfied), with 19 items who addressed both intrinsic aspects of the job (e.g. “The amount of variety in your work”, “Freedom to choose your method of working”) and extrinsic aspects of the job (e.g. “the physical working conditions in your office/studio”, “your job security”, “your relationship with other construction professionals”.) The average job satisfaction leans towards the satisfied side (M = 3,6).
There is no difference between people working solely as an architect (flow 1) and people combining architecture with another sector (flow 2). Flow 3 and flow 4 were not investigated, as this scale is a specific architecture job satisfaction scale.
No gender effects were found for job satisfaction.
Perceived success
Besides job satisfaction, respondents were also asked about their perceived success. Perceived success was measured on a Likert scale from 1 (= very unsuccessful) to 7 (= very successful) with the item “How successful do you consider yourself in your job as an architect in general?” The average perceived success was quite high with an average of 5.12.
There is no difference in perceived success between people working solely as an architect (flow 1) and people combining architecture with another sector (flow 2). Flow 3 and flow 4 were not investigated, as this scale is a specific scale for perceived success as an architect.
Perceived success did not differ across gender, but there are country differences.
Turnover intention
Turnover intentions were measured on a Likert scale from 1 (= Strongly disagree) to 5 (= Strongly agree), with 4 items (“I will be actively searching for a job outside of the architectural profession over the next 12 months,” “I will be actively searching for a new jow over the next 12 months,” “I often think about leaving the architectural profession,” and “I often think about leaving my job”). A higher score equals a higher turnover intention. Turnover intentions were rather low (M = 2.22).
Turnover intentions were higher for people who combined their architecture job with a another job (flow 2) than people who solely work as an architect (flow 1).
|
|
Mean turnover intention
|
SD
|
N
|
|
Working exclusively as an architect
|
2,1850
|
,95513
|
650
|
|
Working as an architect and having a part time occupation in another field
|
2,4053
|
1,06878
|
103
|
|
Total
|
2,2151
|
,97365
|
753
|
No gender effects were found for turnover intentions.
Financial security
Most people earn between €1000 and €1500 netto per month. Of course, this differs strongly from country to country.
|
Net income (in euros per month or per year)
|
%
|
|
< €500/month (€6.000/year)
|
2,9
|
|
€500/month < €1000/month (€12.000/year)
|
13,3
|
|
€1000/month < €1500/month (€18.000/year)
|
19,9
|
|
€1500/month < €2000/month (€24.000/year)
|
13,8
|
|
€2000/month < €2500/month (€30.000/year)
|
12,7
|
|
€2500/month < €3000/month (€36.000/year)
|
9,8
|
|
€3500/month < €4000/month (€42.000/year)
|
7,1
|
|
€4000/month < €4500/month (€48.000/year)
|
3,4
|
|
€4500/month < €5000/month (€54.000/year)
|
3,4
|
|
> €5000/month (€54.000/year)
|
8,2
|
|
I prefer not to say
|
5,5
|
Income also differs from occupational sector. People who work in related sectors (flow 3) earn the most. The lowest income is for the people who combine architecture with another job (flow 2).
|
Net income (in euros per month or per year)
|
Exclusively architecture
|
Architecture + other sector
|
Related sector
|
Unrelated sector
|
|
< €500/month (€6.000/year)
|
2,44%
|
5,71%
|
2,25%
|
4,71%
|
|
€500/month < €1000/month (€12.000/year)
|
16,13%
|
15,24%
|
7,21%
|
4,71%
|
|
€1000/month < €1500/month (€18.000/year)
|
20,09%
|
23,81%
|
15,32%
|
25,88%
|
|
€1500/month < €2000/month (€24.000/year)
|
14,31%
|
9,52%
|
13,96%
|
14,12%
|
|
€2000/month < €2500/month (€30.000/year)
|
12,48%
|
7,62%
|
14,41%
|
16,47%
|
|
€2500/month < €3000/month (€36.000/year)
|
9,13%
|
10,48%
|
11,26%
|
10,59%
|
|
€3500/month < €4000/month (€42.000/year)
|
5,48%
|
10,48%
|
9,46%
|
9,41%
|
|
€4000/month < €4500/month (€48.000/year)
|
3,50%
|
1,90%
|
4,05%
|
2,35%
|
|
€4500/month < €5000/month (€54.000/year)
|
3,04%
|
5,71%
|
4,05%
|
1,18%
|
|
> €5000/month (€54.000/year)
|
7,00%
|
4,76%
|
13,06%
|
9,41%
|
|
I prefer not to say
|
6,39%
|
4,76%
|
4,95%
|
1,18%
|
But there are also gender effects. Women earn less than men.
|
Net income (in euros per month or per year)
|
Male
|
Female
|
|
< €500/month (€6.000/year)
|
1,83%
|
3,70%
|
|
€500/month < €1000/month (€12.000/year)
|
9,57%
|
16,55%
|
|
€1000/month < €1500/month (€18.000/year)
|
19,76%
|
20,25%
|
|
€1500/month < €2000/month (€24.000/year)
|
11,61%
|
15,49%
|
|
€2000/month < €2500/month (€30.000/year)
|
13,85%
|
11,80%
|
|
€2500/month < €3000/month (€36.000/year)
|
11,00%
|
8,80%
|
|
€3500/month < €4000/month (€42.000/year)
|
8,15%
|
6,16%
|
|
€4000/month < €4500/month (€48.000/year)
|
3,87%
|
2,99%
|
|
€4500/month < €5000/month (€54.000/year)
|
3,87%
|
2,99%
|
|
> €5000/month (€54.000/year)
|
10,59%
|
6,34%
|
|
I prefer not to say
|
5,91%
|
4,93%
|
Financial security was not only measured in absolute income, but also in subjective financial position. This has the advantage that possible differences in standard of living between countries are eliminated. Financial position was measured through the question: “How easy is it for you to make ends meet?” This item was measured on a Likert scale from 1 (= Extremely easy) to 5 (= Extremely difficult). Hence, the lower the score, the easier it is to make ends meet. The mean was 2,55 which means that financial position was slightly more on the ‘easy’ side of the ‘make ends meet’-spectrum.
Analogue to the absolute income result, people who combined architecture with another job (flow 2) reported the most difficult financial position (M = 2,86). People who are working outside architecture, find it the easiest to make ends meet (flow 4) (M = 2,18).
|
|
Mean
|
SD
|
|
Exclusively architecture
|
2,66
|
,988
|
|
Architecture + other sector
|
2,86
|
,994
|
|
Related sector
|
2,22
|
,918
|
|
Unrelated sector
|
2,18
|
,953
|
|
Total
|
2,55
|
,996
|
Interestingly, no gender differences were found. This means that women do not report to have it more difficult to make ends meet, but they still earn less than men (in absolute numbers)!
Despite the different measurement method (subjective norm instead of absolute income), differences between countries did not disappear.
Extra comment on flow 2
Flow 2 (people combining architecture with another sector) seems to have the ‘worst’ profile. They report the lowest life satisfaction. Probably this is because they experience a lot of stress (their work-life balance is the worst of all flows) of combining all these aspects of their life. Their financial situation is also the worst of all flows. They consequently have higher turnover intentions. Interestingly, their job satisfaction for their architecture job is not lower. So despite all the challenges, they still enjoy working in architecture.
Report on the first (exploratory) Afterlife study
The goal of the Afterlife project is to gain insight in the different alumni profiles and to detect (mis)matches between the skills that architecture students are taught and those demanded by the industry across Europe.
In a first exploratory study, the educational and professional trajectory of former architecture students was mapped. In this report, we provide information about the professional trajectories of architecture alumni, and shed light on the phenomenon of people who choose to leave the architectural field during their career. Furthermore, we shortly discuss the respondents’ view on their architectural education, and go into further detail about the topics that will be investigated in a follow-up study.
Participants
Both architecture graduates and students who left their architecture education were questioned, resulting in 2664 responses.
Participants were 44% male and 56% female, and belonged to the following age categories:
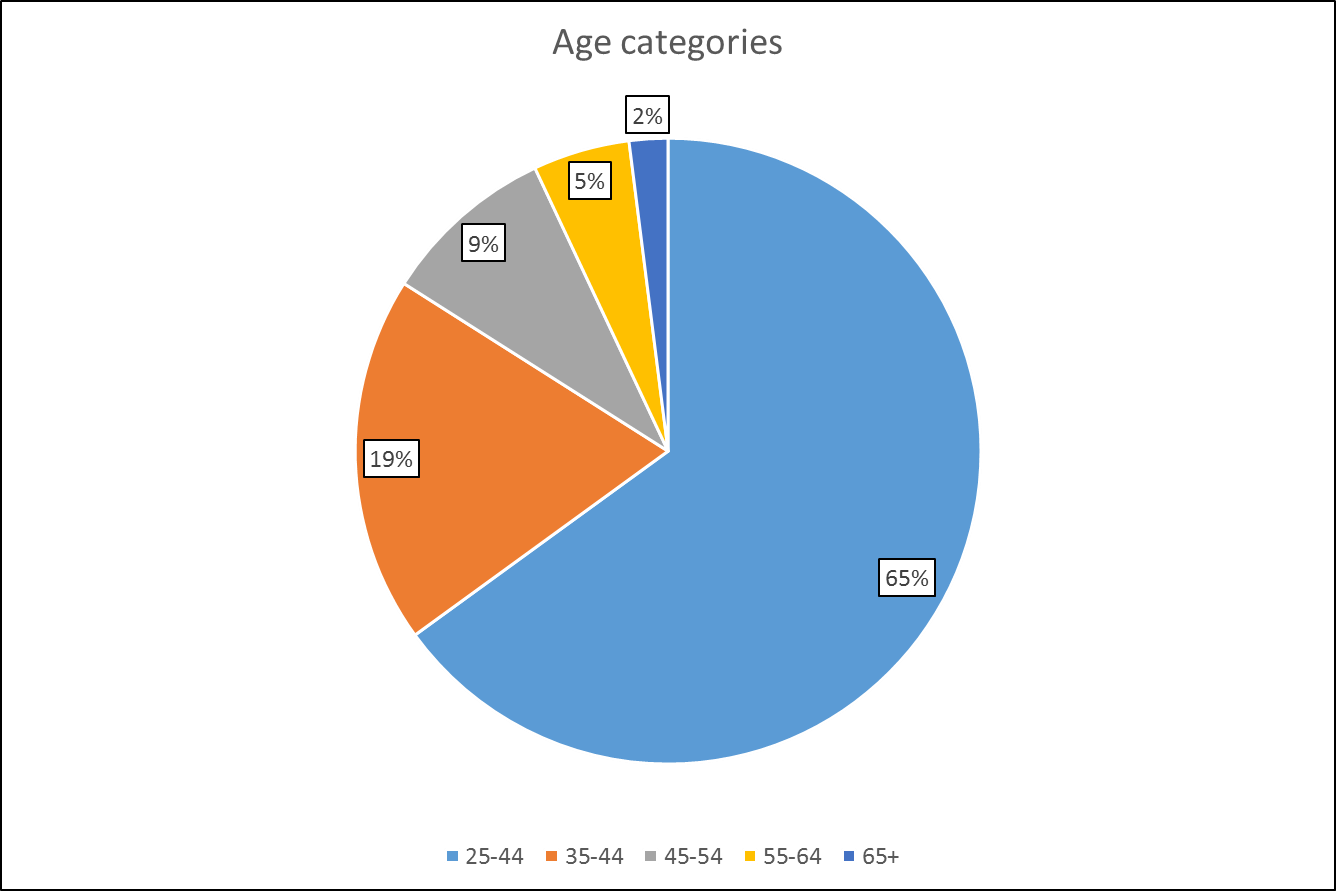
A considerable number of countries was represented (N = 91), with participants mainly living in Belgium, Spain, France, United Kingdom, Greece, Croatia, Italy, and Turkey.
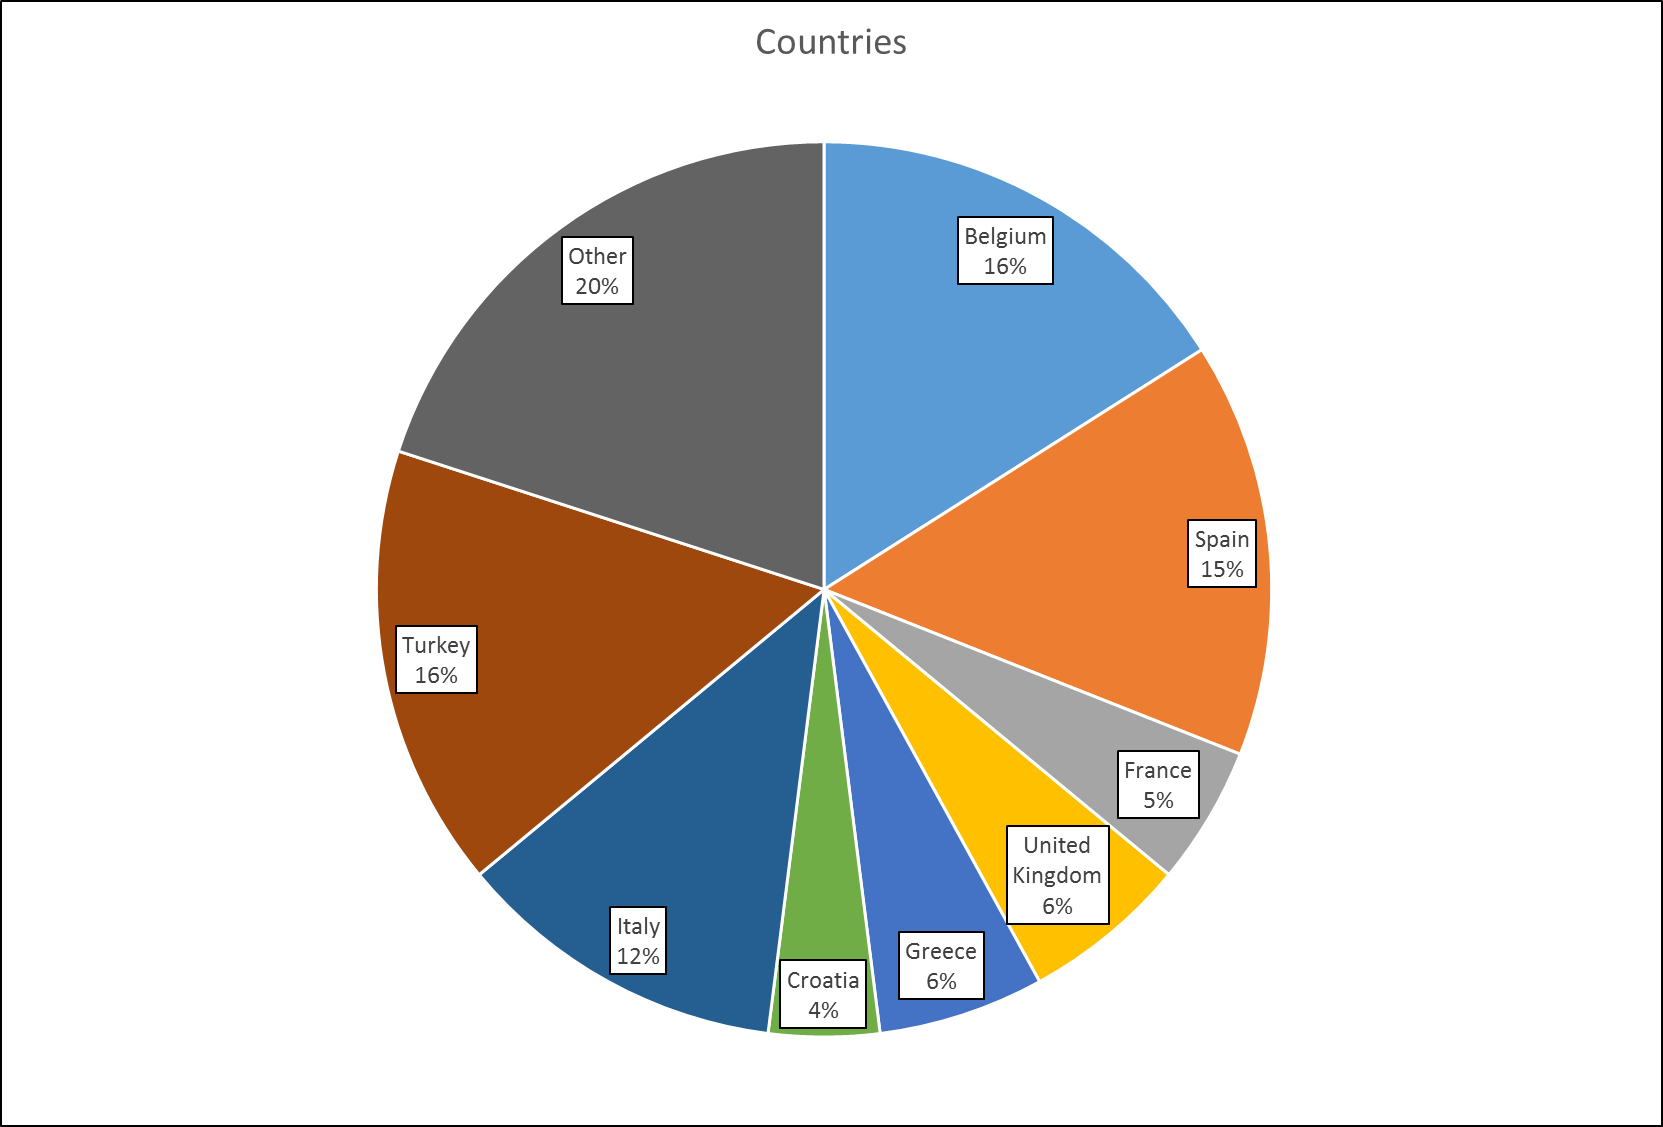
Professional status
Of the 2211 architecture graduates who were professionally active, 73% was working as an architect (63% exclusively, and 10% in combination with another field), 21% was working in a field related to architecture, and 6% was working in a field outside architecture.
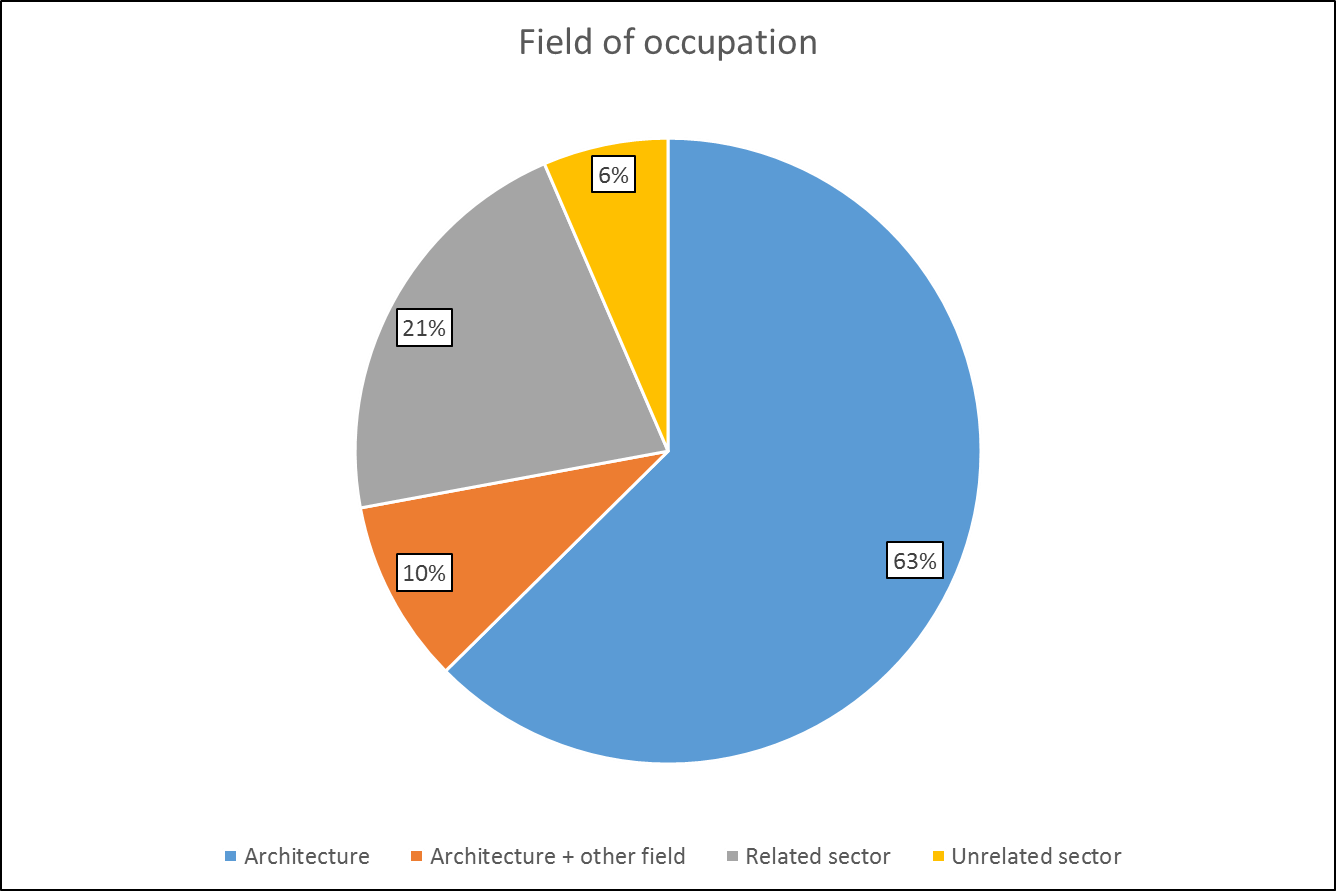
The degree in which respondents were working in a certain field, was dependent from the country where they were living. In Belgium, Spain, France, Greece and Croatia, between 60% and 70% of the working respondents is exclusively active as an architect. In the United Kingdom and in Italy, less than 50% is currently exclusively working as an architect. An peak can be detected in Turkey, with more than 80% of the respondents working exclusively in architecture.
In some countries it is more usual than in other countries to combine work in architecture with work in another field. For instance, in Belgium and Turkey, it is unusual to combine another field with architecture (less than 10%), whereas in Spain, France, the United Kingdom, Greece and Croatia, more than 10% of the working respondents, combine architecture with another job.
In Belgium, the United Kingdom, and in Italy, more than 25% of the respondents is working in a related sector, whereas in Turkey, this is only 13%. Also in Turkey, few people work in an unrelated sector (only 2%). Out of all countries, Italy has the most respondents who are working in an unrelated sector (i.e. 16%).
Note that the survey responses may partially be influenced by the way the survey was distributed in each country (e.g. through alumni networks vs. through architecture networks). Nevertheless, general trends can be detected.
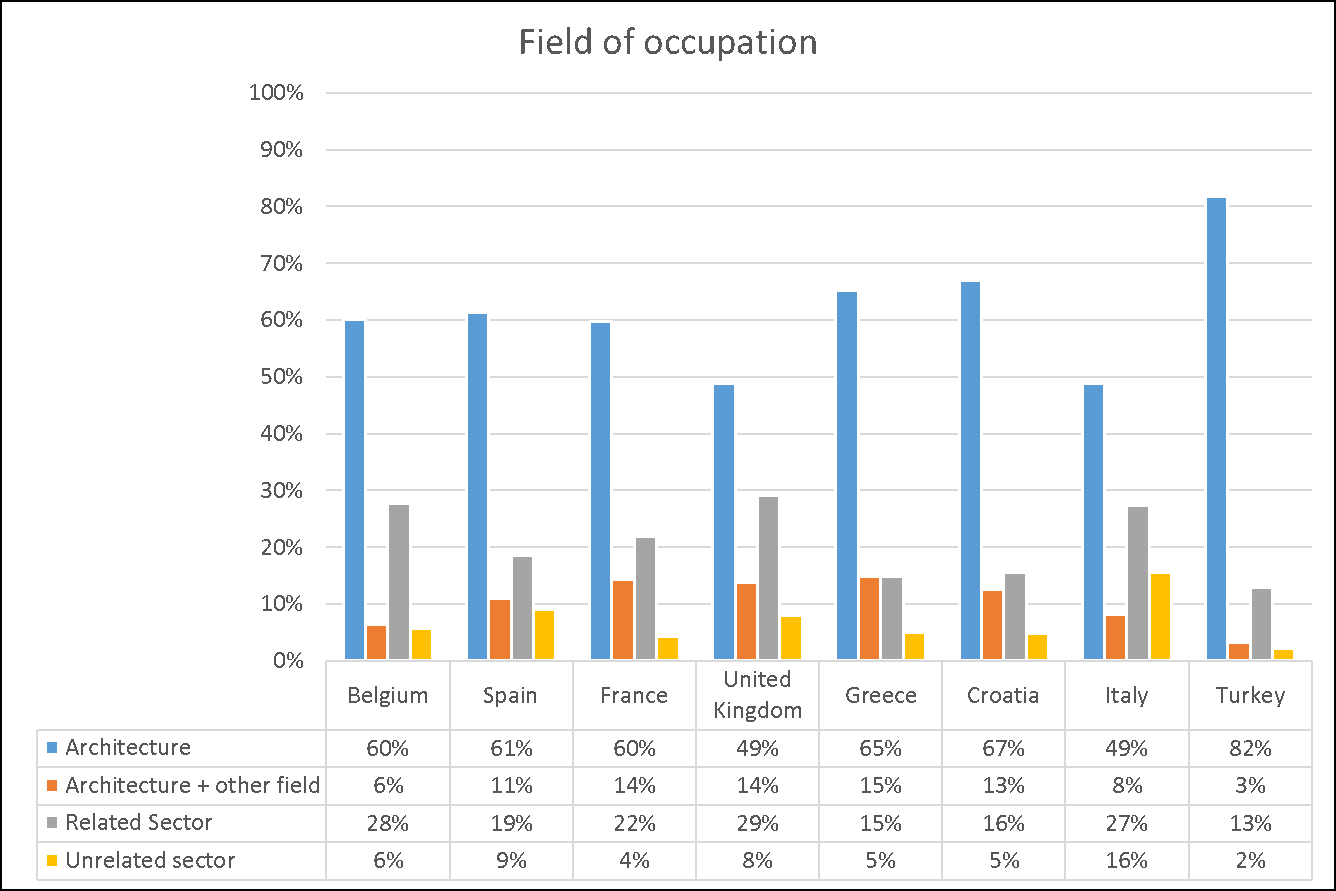
When we look in more detail to the sectors that are combined with architecture, we see that interior architecture, and teaching in higher education are the most popular combination options. Other jobs that are often combined with architecture are jobs in urban planning, building construction, consultancy, research, and creative industries.
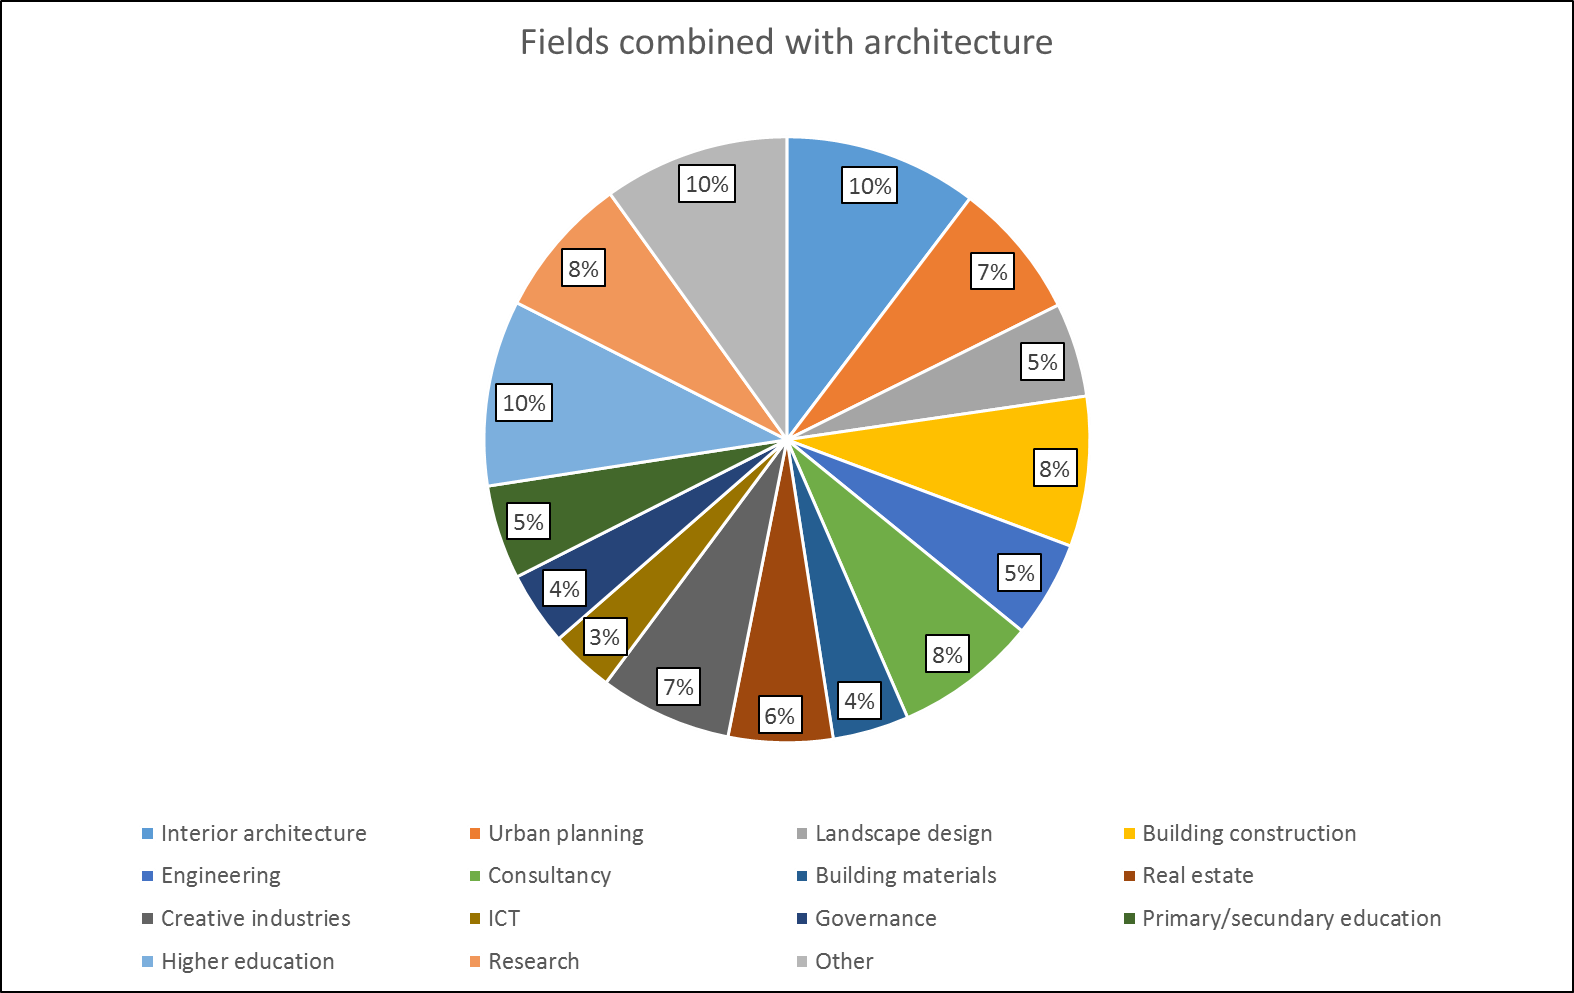
When we compare this to the respondents who work exclusively in related sectors (thus, not combining a job as architecture with another job), we see a slightly different pattern. The same sectors stay very popular, but the most chosen sectors are consultancy and higher education.
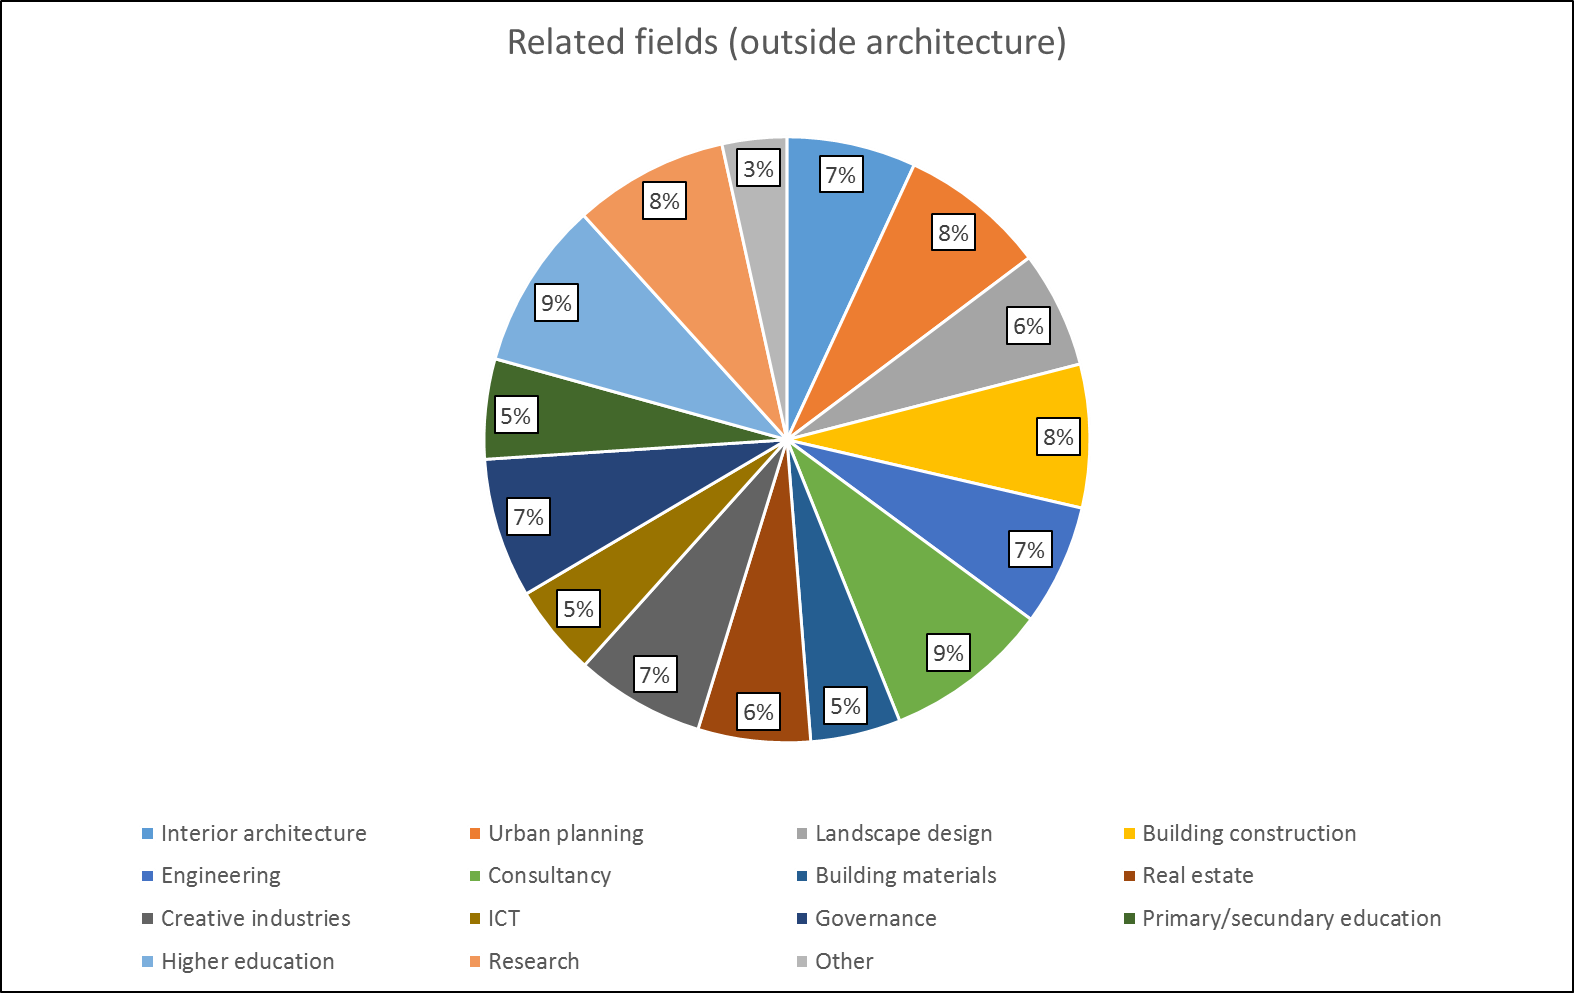
Leaving the architectural field
Very interesting is the timing of leaving the sector. Only 17% left the architectural field immediately after graduation, which means that the vast majority decided to leave the sector after working in the field for some time. Of the people who stopped working as an architect, more than 25% did that in the first year. More than half of the people stopped in the first three years, and more than 75% stopped in the first seven years.
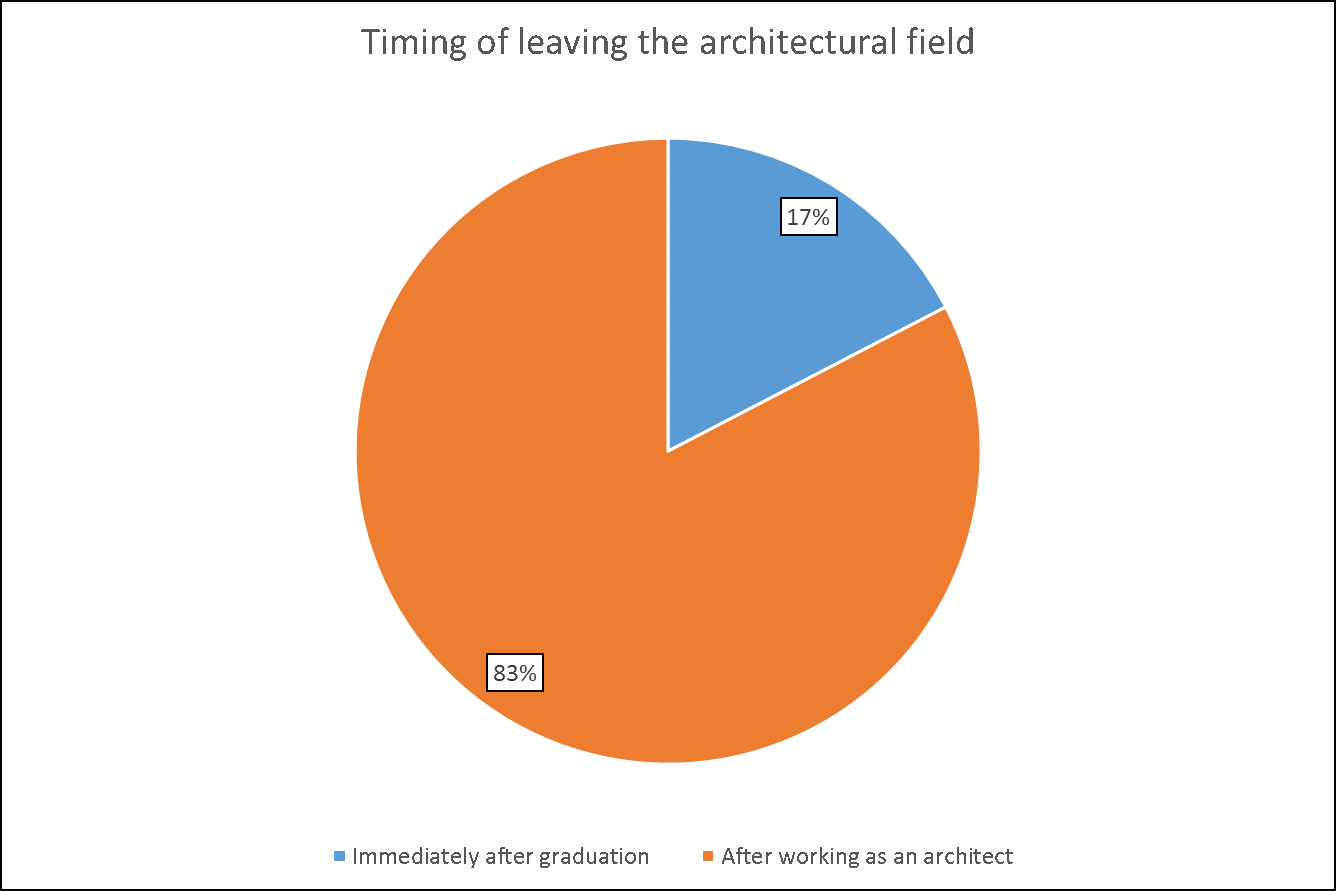
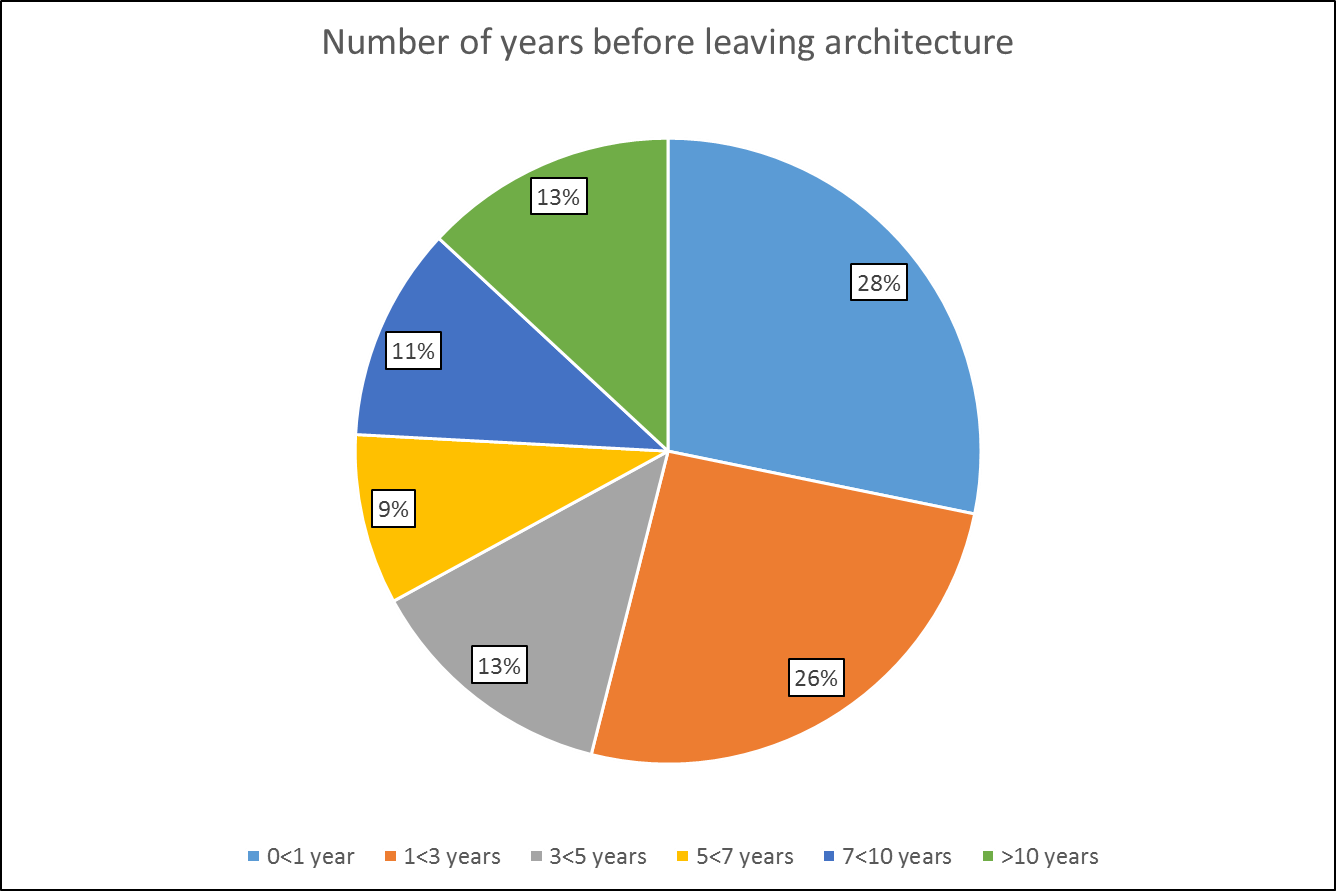
This pattern differs across countries. In Belgium, France, and Italy, more than 25% left the architectural field immediately after education. In Spain, Greece, and Turkey, this is less than 15%. When we look at the number of people who are currently not working as an architect but used to work as an architect in the past, we see that some countries have more ‘early leavers’ than others. In Croatia, Italy, and Turkey, leaving architects stop earlier in their career, than in Belgium, Spain France, United Kingdom and Greece. In the latter countries, the ‘drop-out’ is more distributed over time.
Note that the distribution of ‘number of years before leaving architecture’ depends on the number of participants in each country. For instance, Croatia has only 17 participants who filled in that question, compared to 82 in Belgium. This can lead to more ‘extreme’ results. A complete overview of country participation is given earlier in this report.
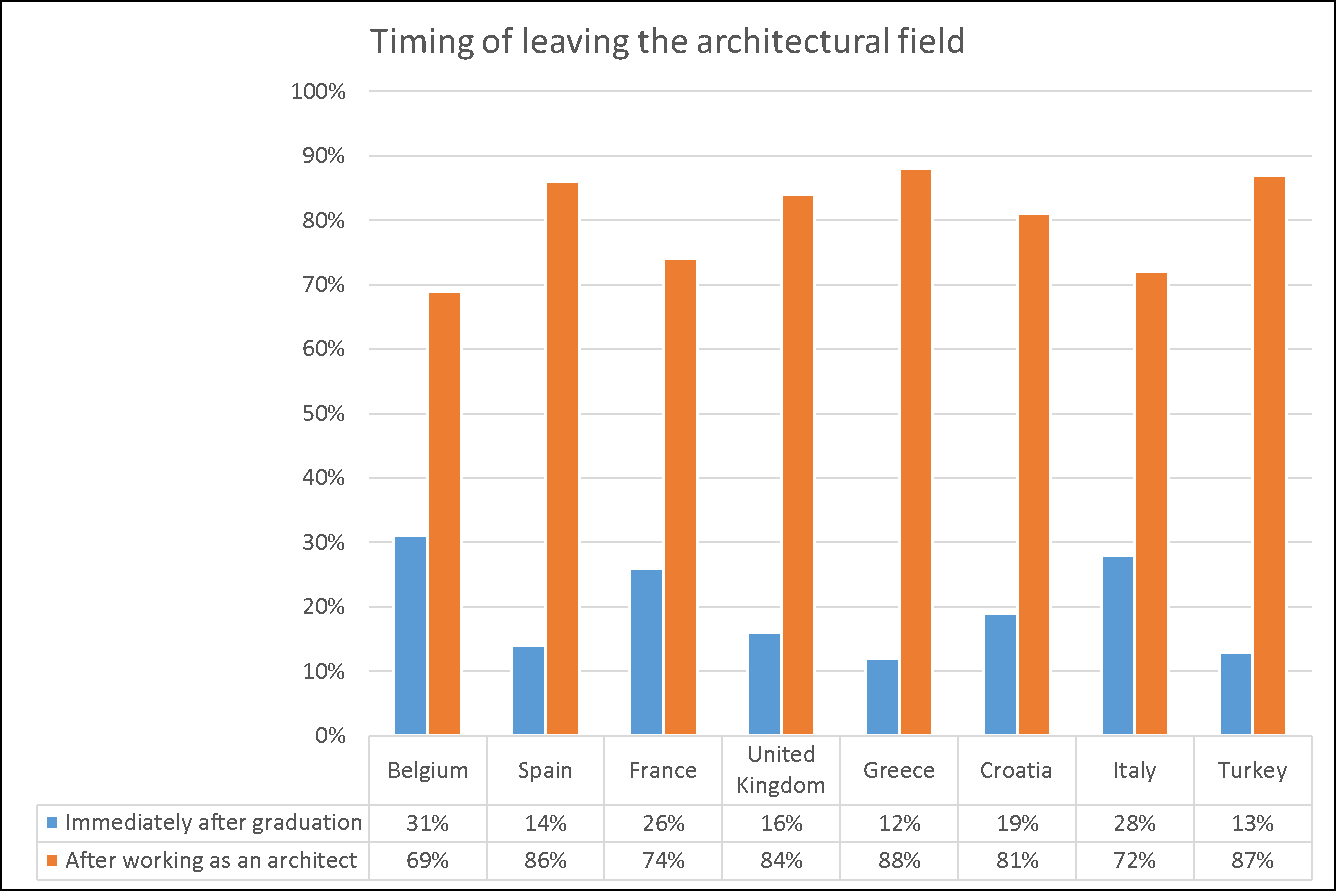
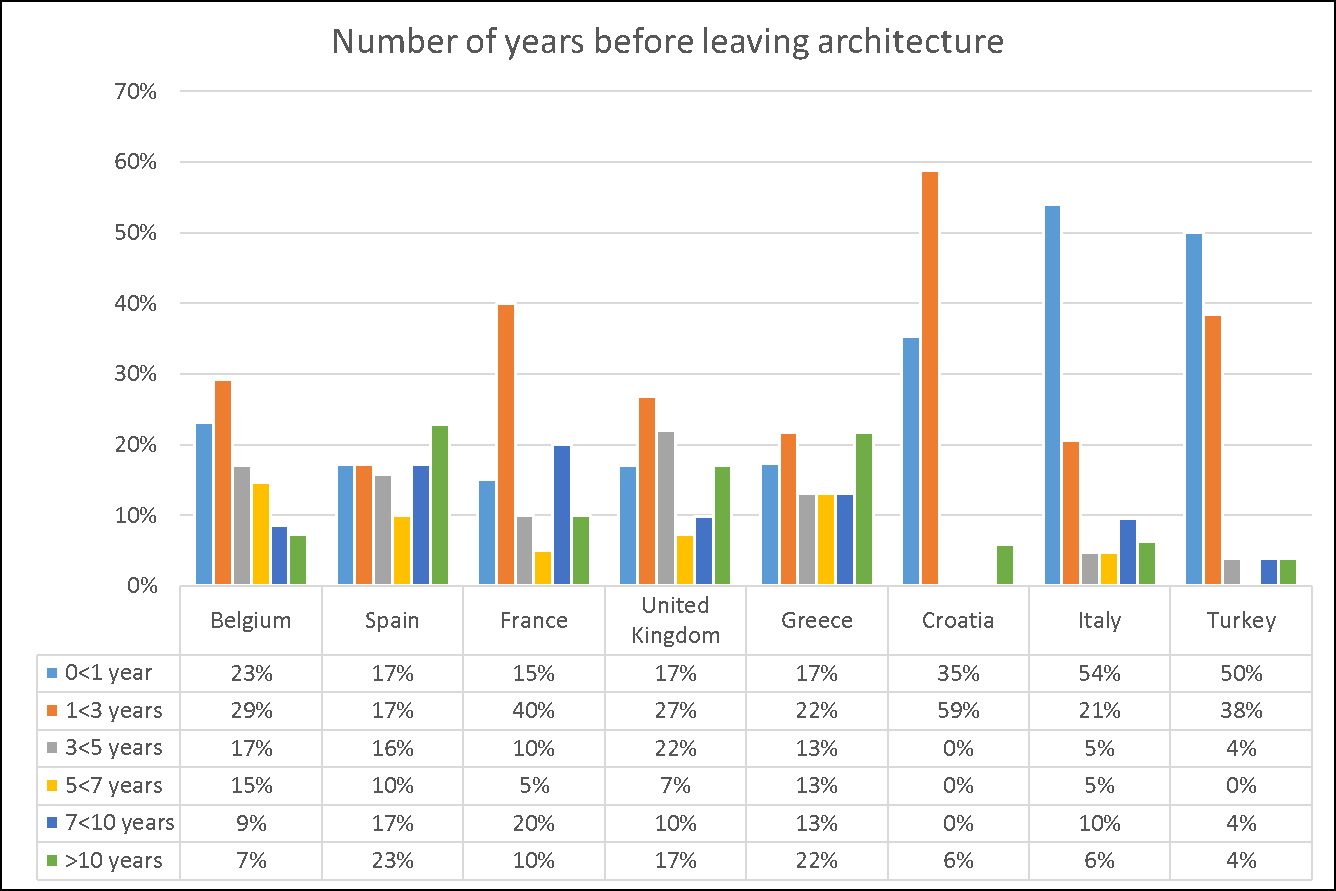
In general, only 9% of the people who left architecture regrets this choice. When we look at the results of the different countries, we can conclude that leavers in Belgium, Spain, France, and the United Kingdom are quite sure of their choice, whereas in Greece, Croatia, Italy, and Turkey people are far more ambivalent about whether leaving was the right choice or not.
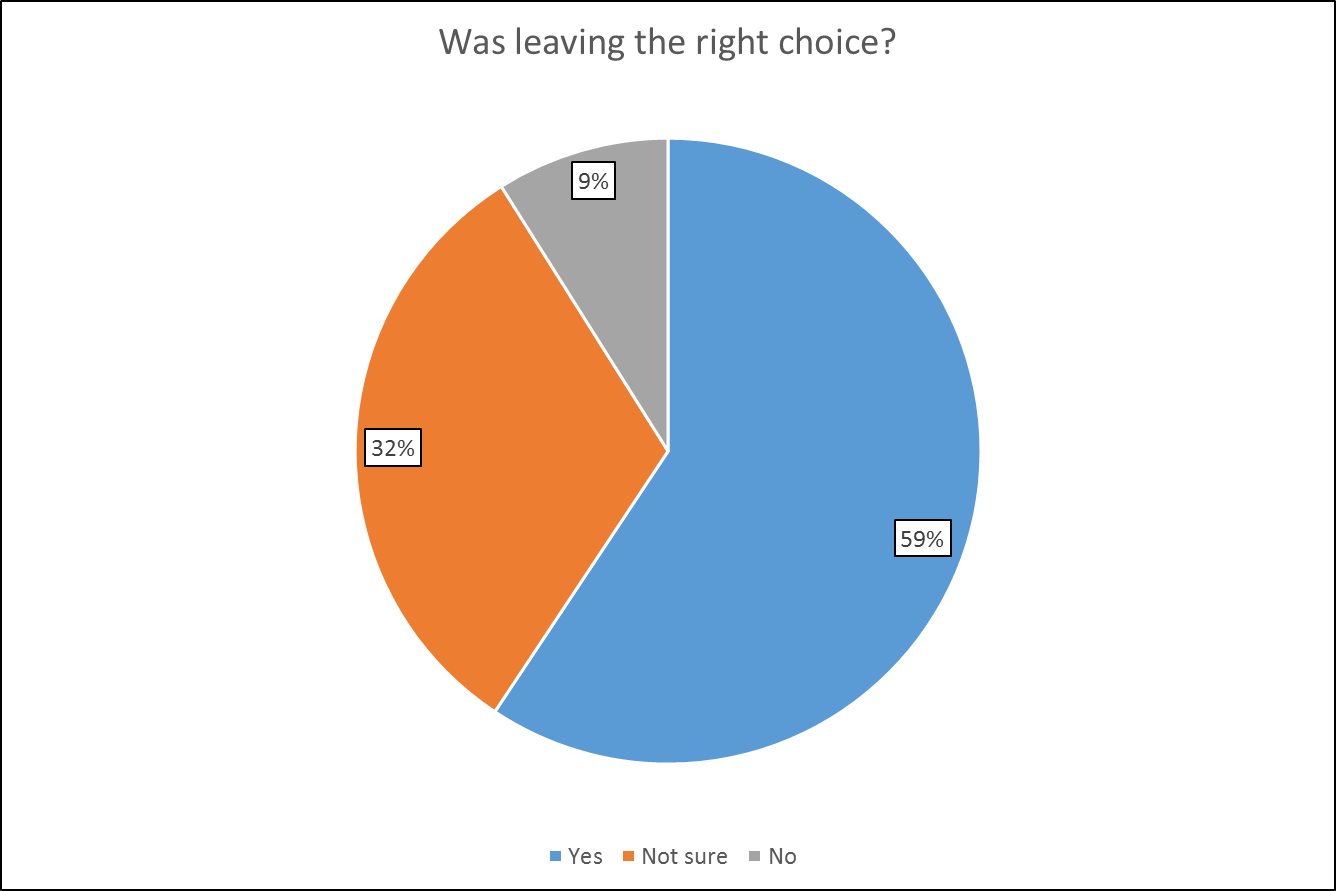
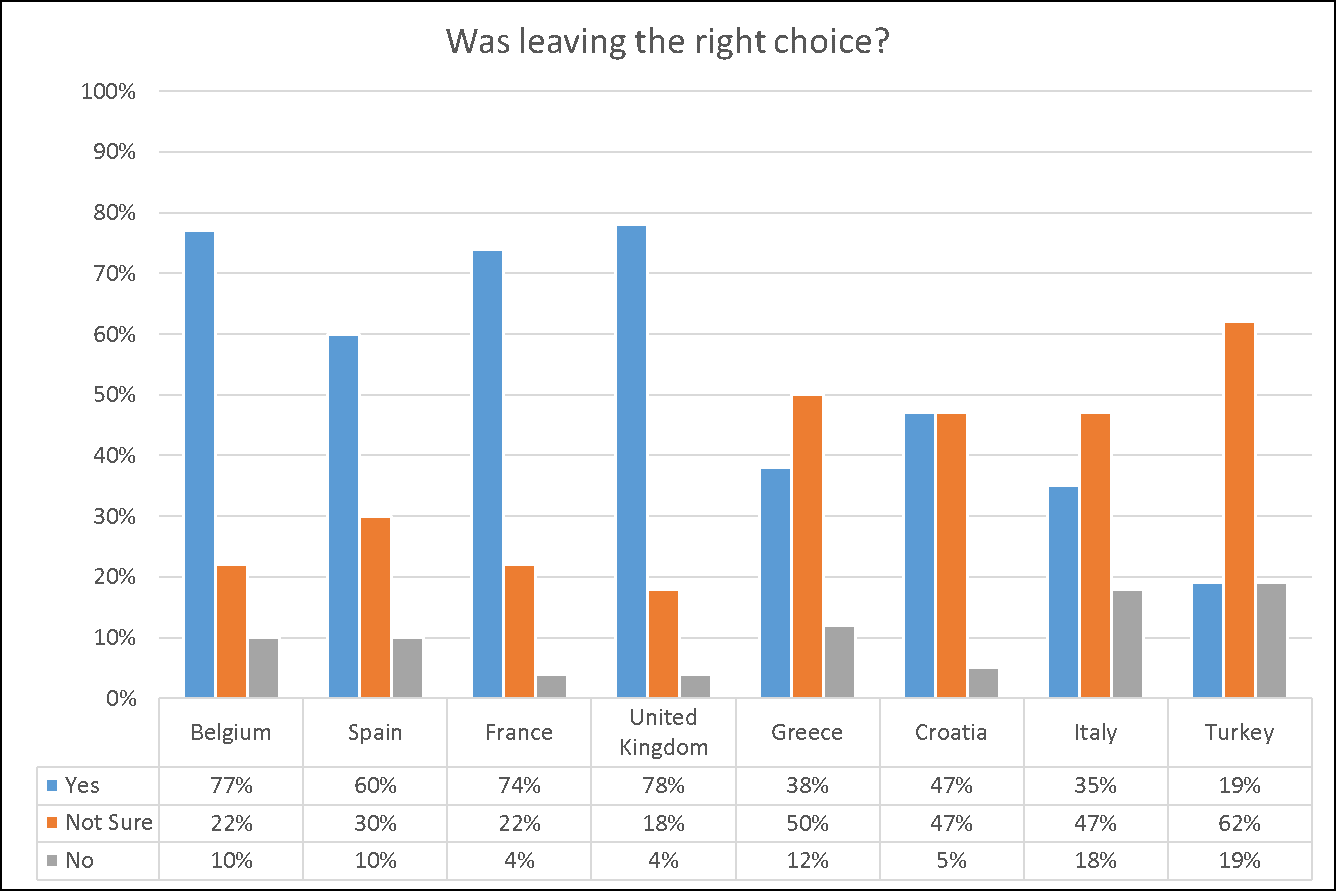
When it comes to the reason why people leave the architectural field, a minority points at practical reasons, such as child care or continuing education. More than 90% of the respondents says that there were other substantial reasons to change sector. Preliminary analyses of reported reasons include bad job conditions (such as bad pay, high workload, poor work-life balance, etc.), loss of interest in the job, or problems with other professionals or craftspeople.
In future research, we will further explore the reasons why so many people decide to leave the architectural sector.
Architectural education
In general, people reported that their architecture studies prepared them well for their professional life (regardless whether they were currently still practicing architecture or not): 63% answered ‘yes’ on the question “Did your architecture studies prepare you well for your professional life?”
In Spain, the United Kingdom, and Greece, respondents are most satisfied with the preparation of their studies on their professional life.
Note that these results are influenced by the response rate across institutions in the respective countries.
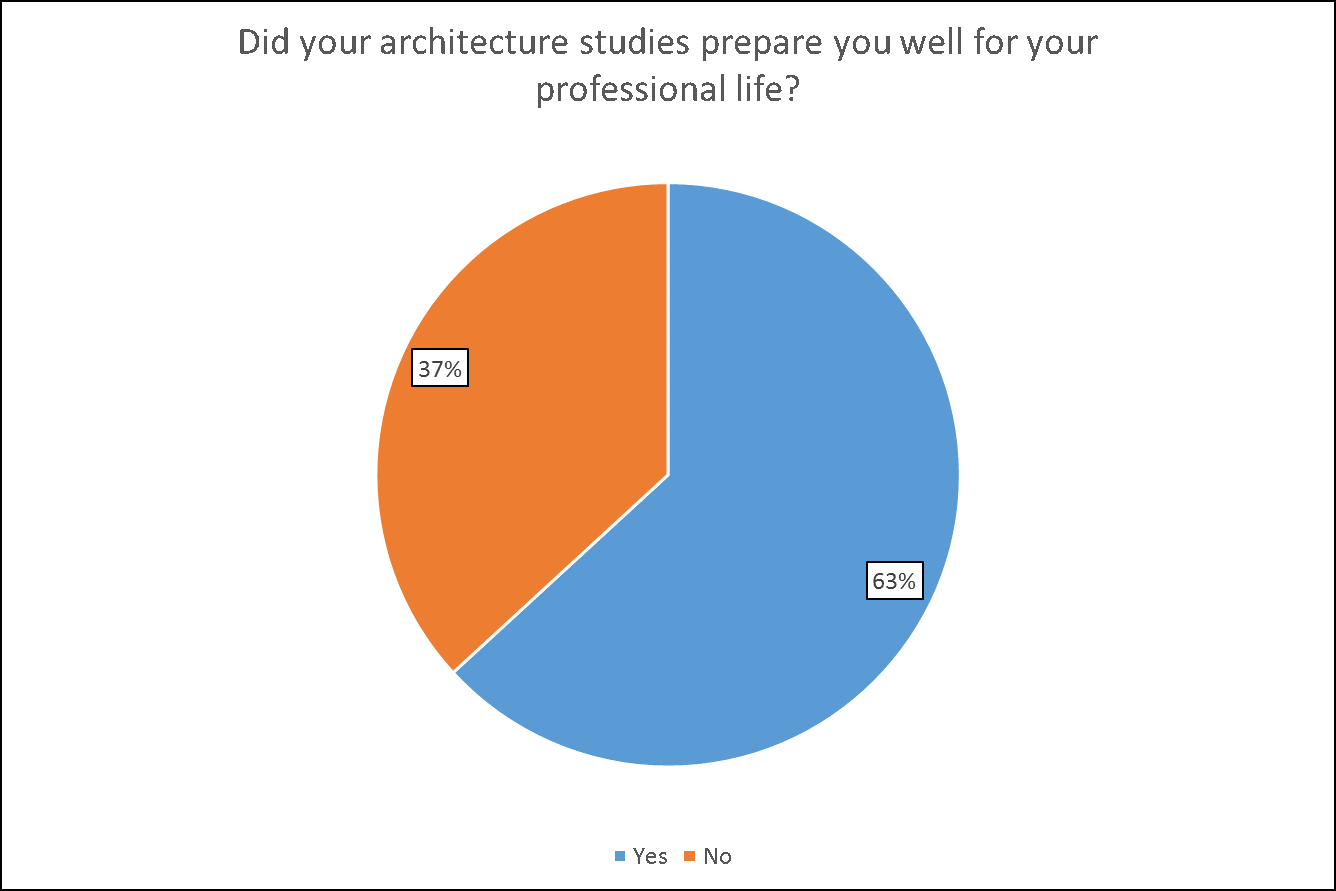
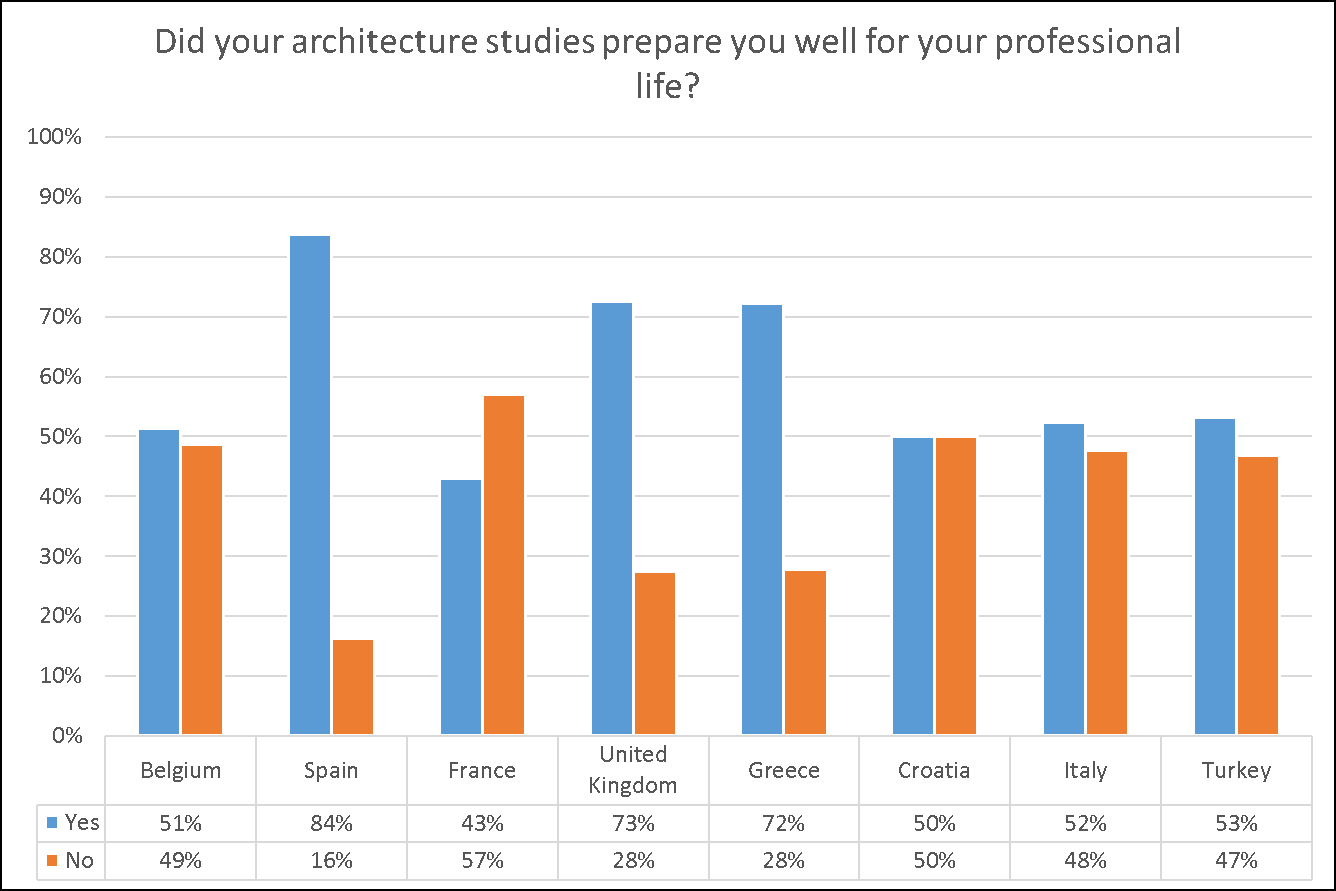
People reported a variety of important competences that they acquired through architectural education. They also indicated some gaps in their architectural education. With regard to points of improvement, they often responded that their curriculum contained too little opportunities for practical experience, and that they felt insufficiently prepared for the practical aspect of running a business in architecture. A more systematic investigation on the importance of different competences will be carried out in future research. The current exploratory study serves as a starting point, to identify relevant competences in education and practice.
Participants were also asked if they wish they had studied something different than architecture. We can expect that most people would choose again for architecture, as 52% responds ‘no’ to this question. Again, results differed across countries, with respondents in the United Kingdom and Greece most frequently reporting that they do not wish they had studied something different. Note that these are also two countries that were quite satisfied with the preparation of their studies for their professional life.
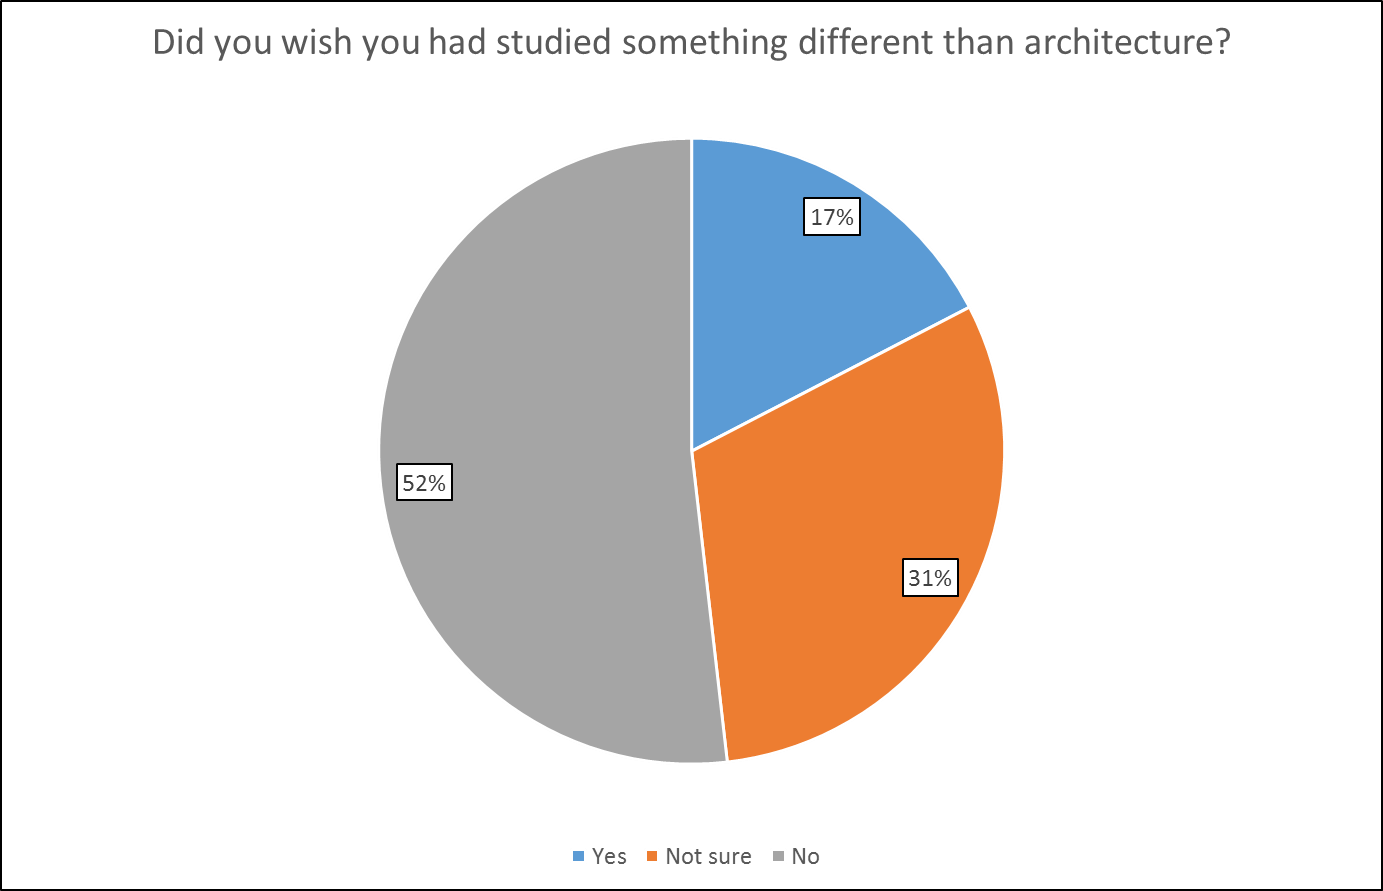
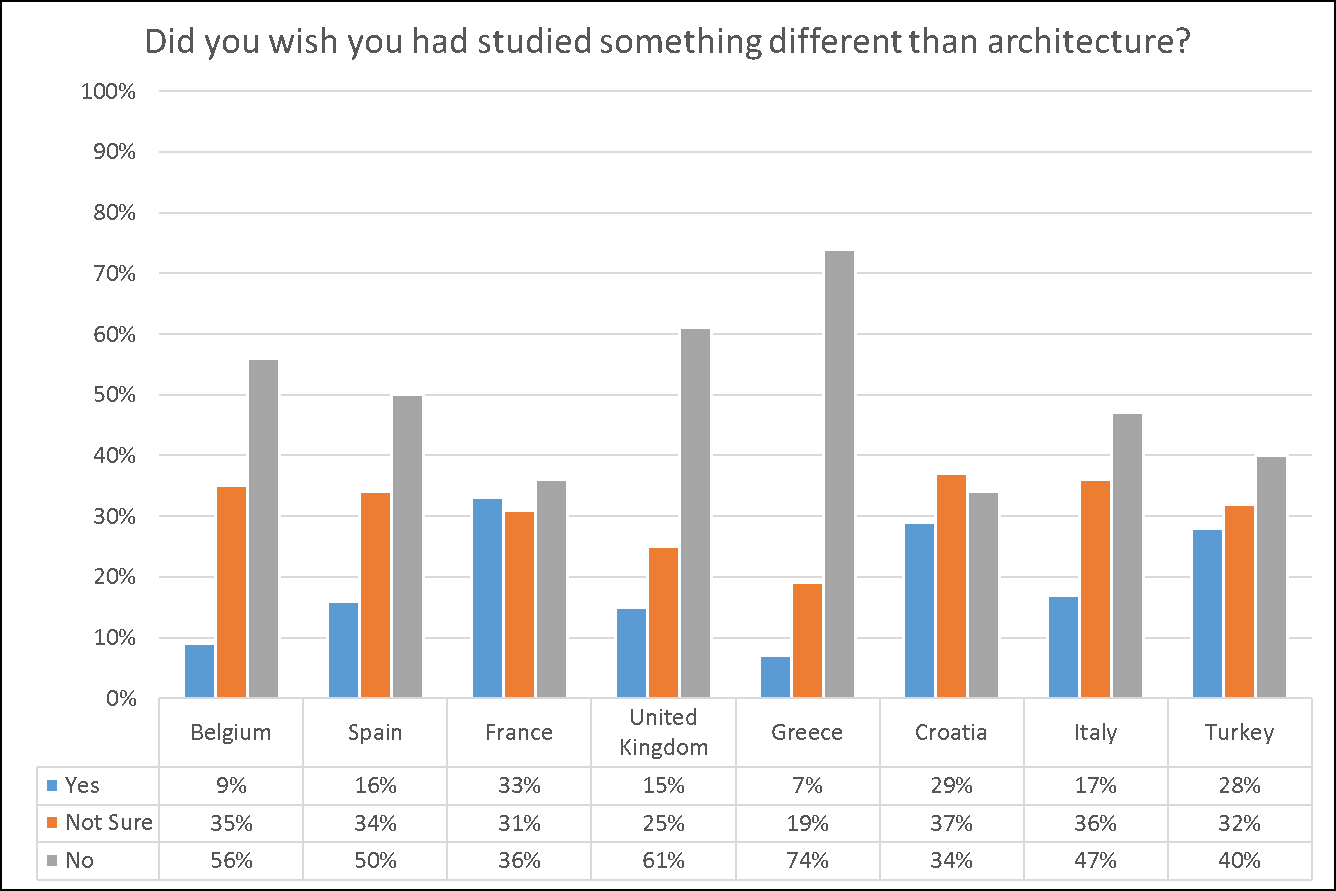
Income
Income significantly differed across fields of occupation. A striking result is that the highest income scales were most often obtained in the sectors that were related to architecture.
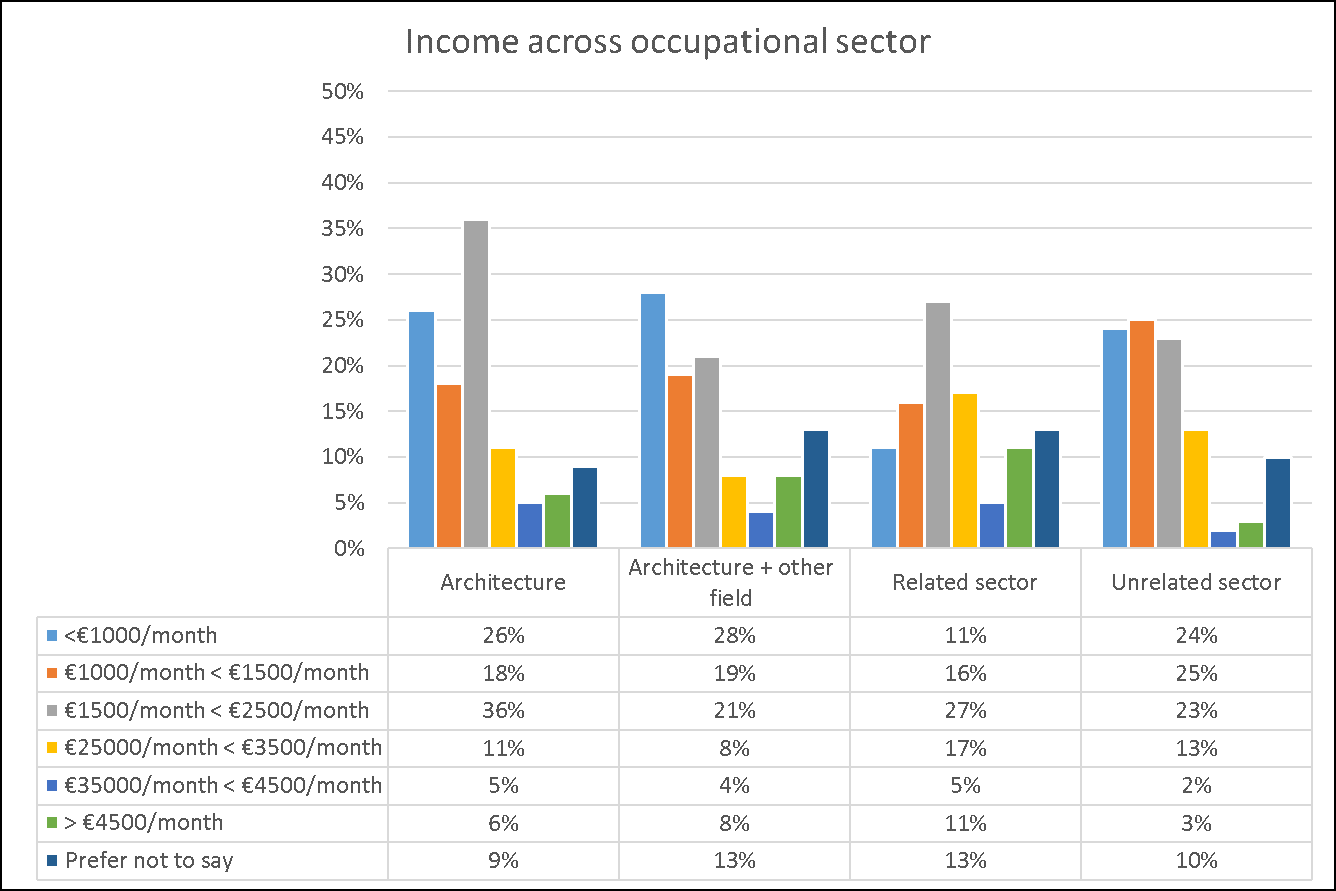
Note that income is also dependent from country, and that the distribution of field of occupation differs across country. In a follow-up study, the impact of sector on income and income satisfaction will also be controlled for country of work.
Future research
Currently, a follow-up study is carried out to investigate the described patterns in more detail. Where this exploratory study aimed to collect describing data, and invited the respondents to write down their thoughts and concerns, the follow-up study will adopt a more quantitative approach. The answers that were given in the exploratory study are analyzed, and transformed to a questionnaire that aspires to detect relationships between architectural education, professional life, and work-life balance in general.
Firstly, in the follow-up study, we further investigate the drop-out pathways during architectural education and during the architectural career.
Secondly, the follow-up study investigates whether a given set of competences or skills are acquired through architectural education, and how well this matches with the demands of the workplace.
Thirdly, ample attention is given to work-life balance, job satisfaction, and financial aspects of working as an architect.